SciChart.js v6 in Alpha – WebGPU, Incredible Performance Gains and more
Our team has been working hard on continued R&D with SciChart.js – High Performance JavaScript Charts – and today we’d […]

Running Raspberry Pi OS on VMWare Player is a powerful way to simulate embedded environments without needing dedicated hardware. Whether you’re building human-machine interfaces (HMI), SCADA dashboards, or monitoring industrial and IoT systems, the Raspberry Pi ecosystem is widely adopted for its flexibility, GPIO access, and strong community support.
In many of these applications, real-time data visualization is critical – and that’s where tools like SciChart.js come in. This guide walks you through setting up Raspberry Pi OS in a VMWare virtual environment, and demonstrates how to render high-performance, real-time JavaScript charts using SciChart.js – perfect for engineers and developers working in embedded analytics, telemetry, and control systems.
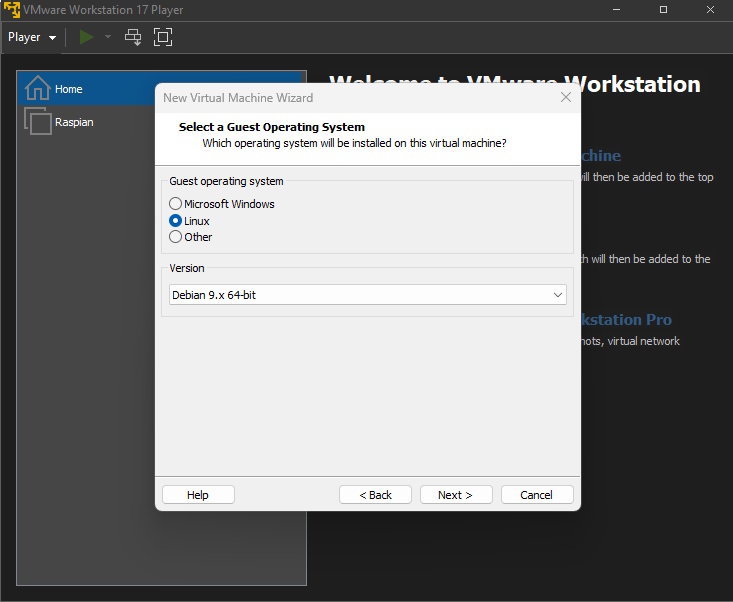
First of all we’re going to show you how to install Raspberry Pi OS on VMWare player.
If you’ve already done this, or are using a real Raspberry Pi device then feel free to skip to Part 2.
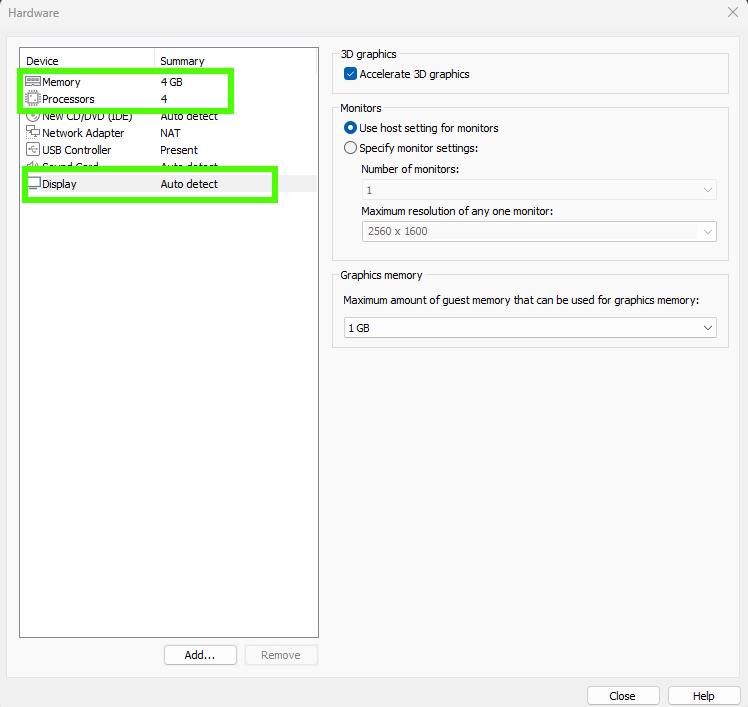
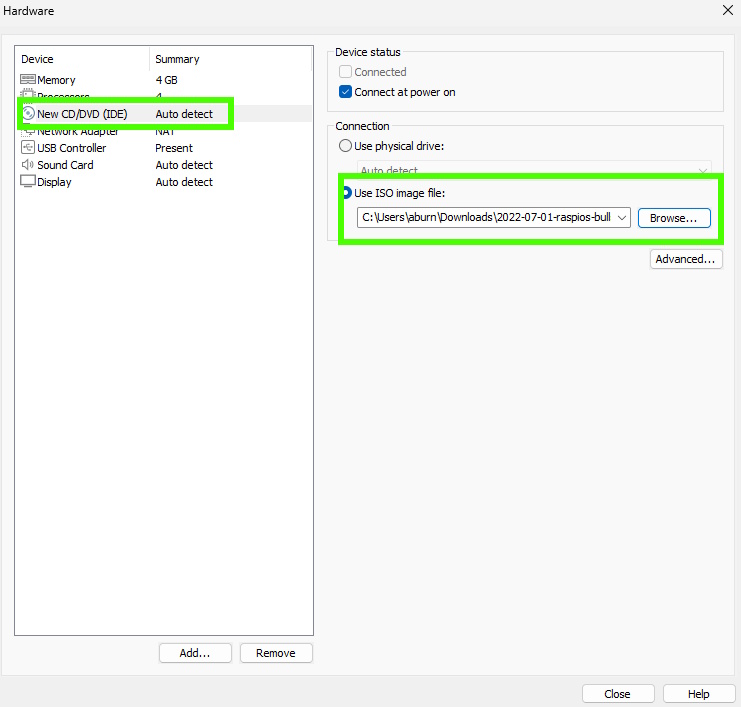
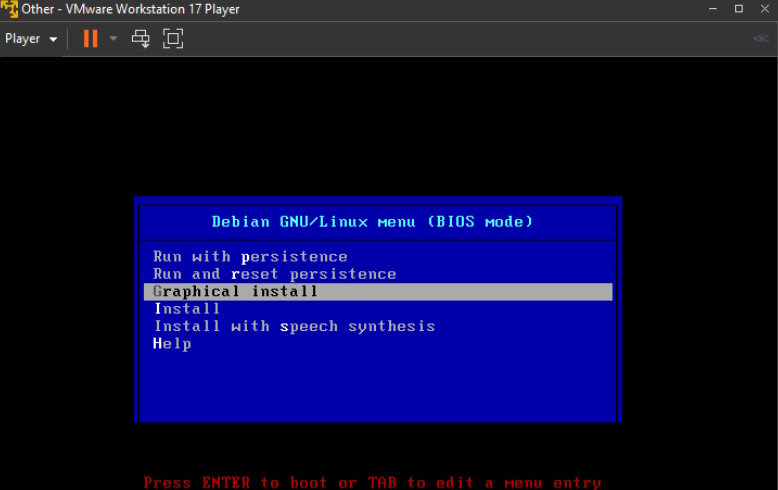
The setup of Raspberry Pi OS on VMWare wasn’t trivial so the first section of the blog will be dedicated to setup and configuration of the Raspberry Pi Guest OS. After that we’ll talk about checking and enabling WebGL hardware acceleration and finally running the SciChart.js demos on Raspberry Pi OS, to showcase the speed, power and performance of this JavaScript Chart library for HMI, Scada or IoT industrial monitoring solutions.
There’s a hugely useful guide here which we mostly followed, with some minor amendments to get this working:

OK, the steps are now as follows:
Make sure to follow the steps from the video we mentioned before, in case you get stuck!
Now that you have VMWare setup to run Raspberry Pi OS, the next problem you’re going to have is enabling WebGL support so that that the SciChart.js demos can run.
If you open the Chromium browser in Raspberry Pi OS, and navigate to scichart.com/demo and open any demo, you’ll see that the chart is blank.
By right-clicking the demo and selecting “Inspect Element” you can view the Google Chrome dev tools and see errors in the console.

The error is:
Uncaught (in promise). Error: SciChart: WebGL not supported!
at e.getContext (bundle.js:29:4220440)
at t.getMasterCanvas (bundle.js:29:3390142)
Let’s go ahead and solve this.
SciChart.js requires WebGL to run. Thankfully this is supported by almost all computers, even Raspberry Pi (see the SciChart.js System Requirements here), the error/issue is coming from VMWare hardware acceleration itself.
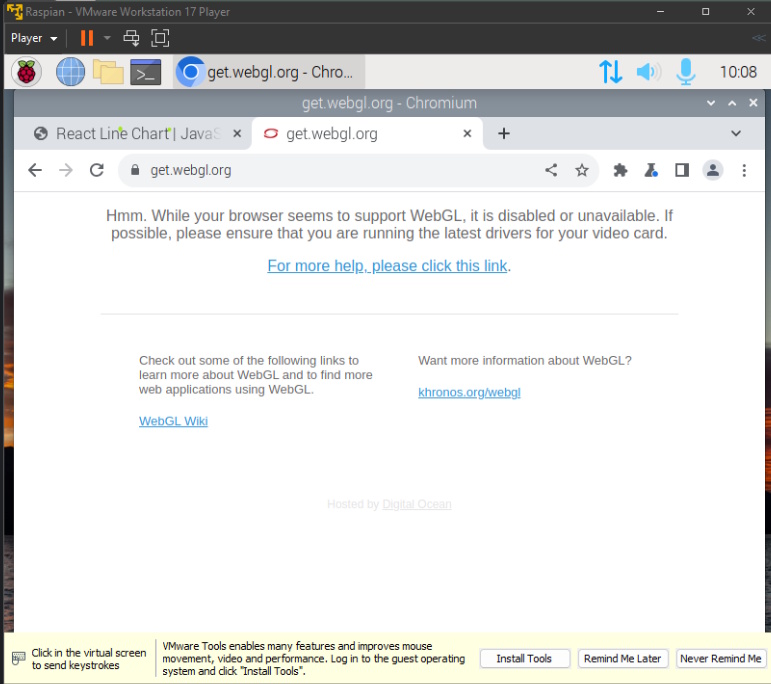
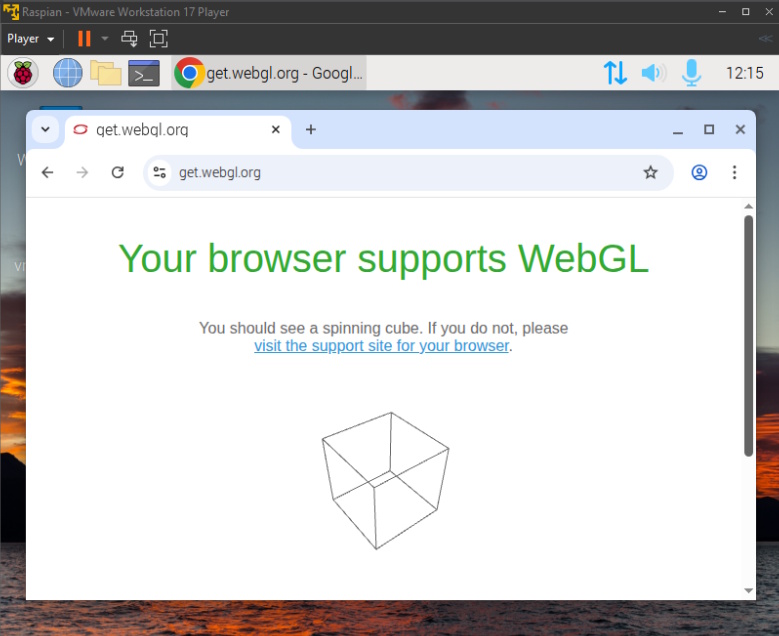
A quick way to check if a browser or system supports WebGL is to visit https://get.webgl.org/ in a browser. If WebGL is supported, then you should see a spinning cube. You can also get a more comprehensive report by visiting https://webglreport.com/.
Loading get.webgl.org up in Chromium inside Raspberry Pi OS in VMWare however, you will see an error:
Hmm. While your browser seems to support WebGL, it is disabled or unavailable. If possible, please ensure you are running the latest drivers for your video card.
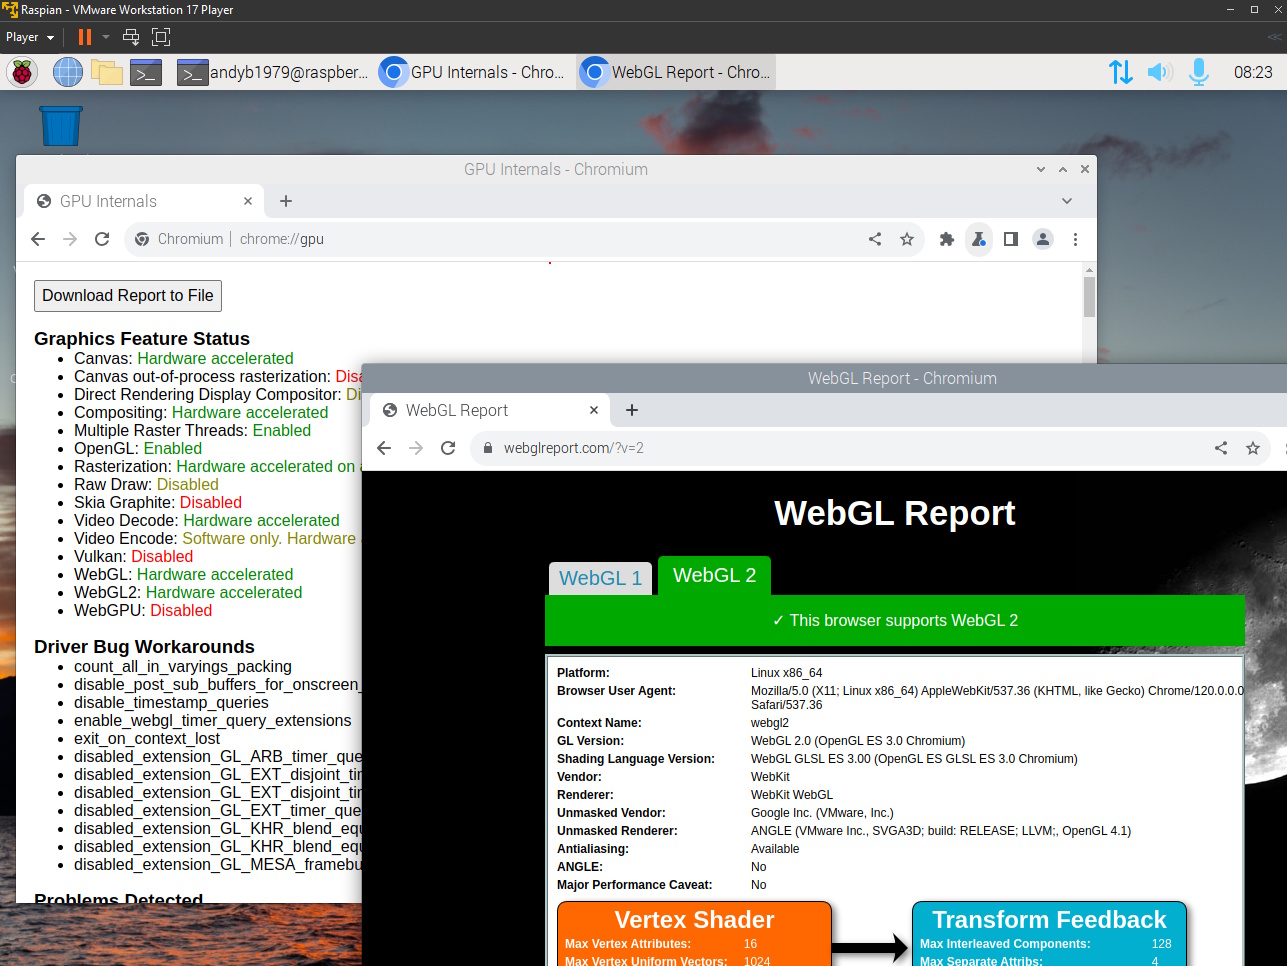
You can further check this by going to chrome://gpu in the browser address bar.
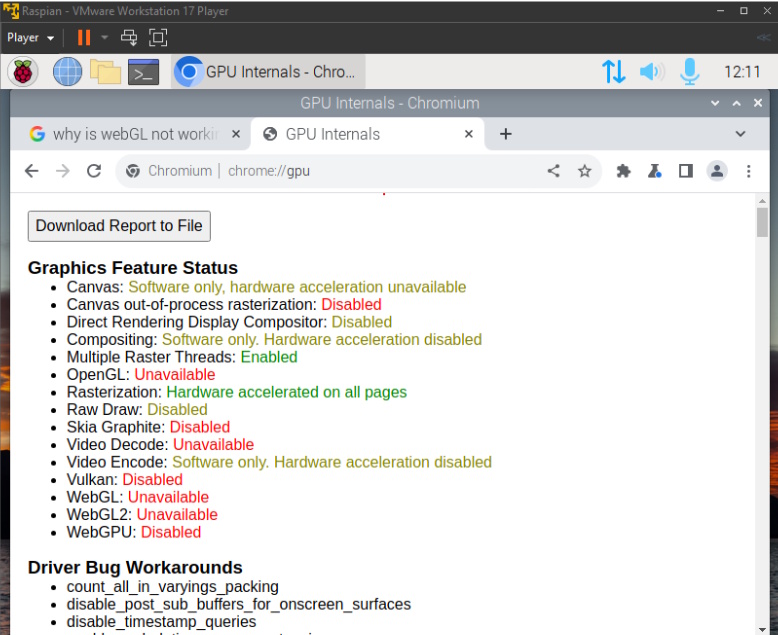
This reports the GPU internals. You can see WebGL: Unavailable. This is a VMWare setting and can be corrected in the following steps.
OK let’s resolve the issue and get WebGL enabled, so that SciChart.js demos can run with WebGL support.
 Extract VMWare Tools
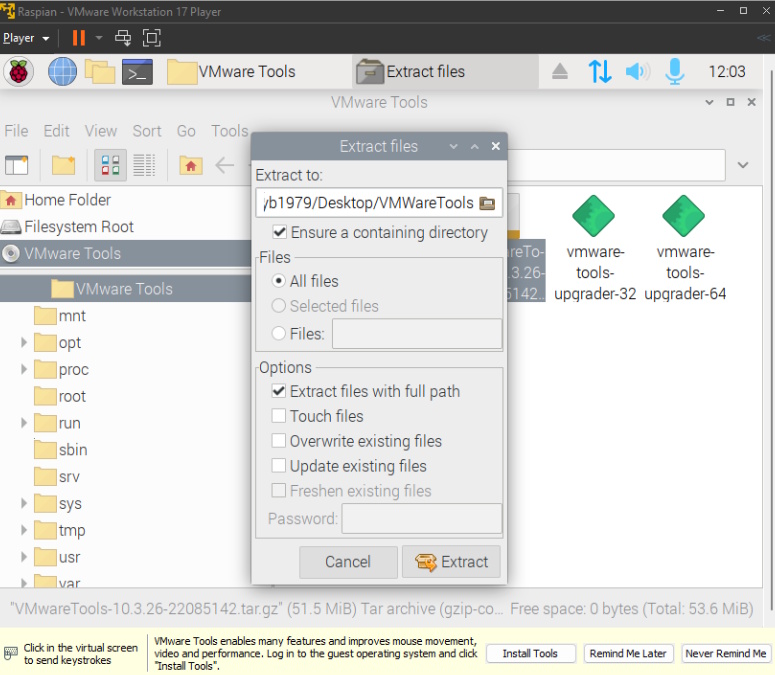 Extract VMware tools
 Install VMWare tools
 Completed VMWare tools install showing X warning
Note: When installing the VMWare tools I saw the warning “Skipping X configuration because X drivers are not supported”. Googling this I discovered that VMWare won’t support hardware acceleration for Raspberry Pi OS in VMWare, however it’s still possible to emulate WebGL support using software rendering. Read on to find out how.
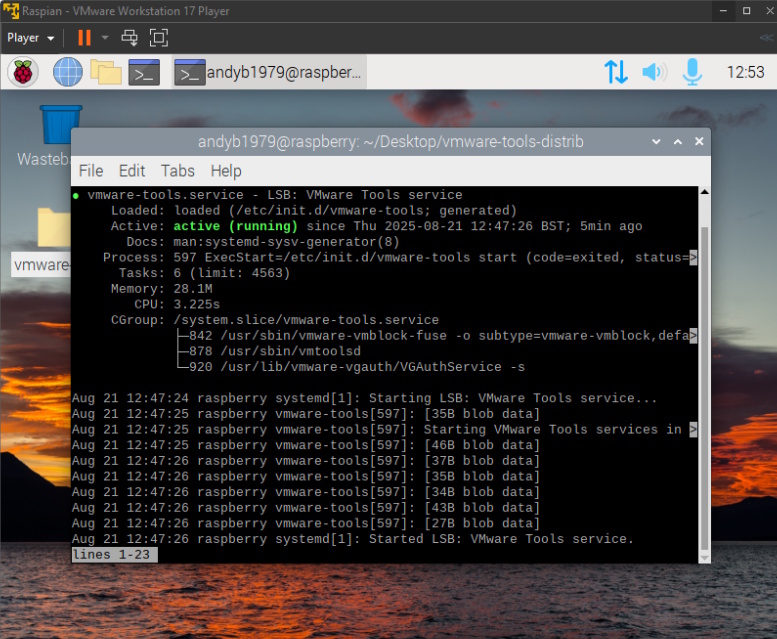
To check VMWare tools are installed, run the command
sudo service vmware-tools status
If the tools are installed, you should see a success message.
Another step I found helpful was to install Google Chrome browser official (not the Chromium which ships with Raspberry Pi OS by default). Google Chrome has software emulation for WebGL via SwiftShader.
With chrome installed, go to chrome://gpu and you should now see WebGL support via software emulation.

This is cool, but we still don’t have full hardware acceleration and therefore true WebGL support in the Raspberry Pi OS Guest on VMWare.
It’s good enough for testing out SciChart.js on Raspberry Pi OS using a virtual machine though, so we’ll continue!
Note: on a real Raspberry Pi 4 or 5 device, you’ll see “Hardware Accelerated” under WebGL support in chrome://gpu and performance of SciChart.js will be much better, so there is no issue running SciChart.js on this platform. It’s just the Virtual Machine causing troubles.
OK with a little more head scratching and interaction with Chat-GPT, I managed to get full WebGL hardware acceleration working in Raspberry Pi OS on VMWare.
What I learned with a lengthy conversation with the chatbot was that:
/usr/lib/x86-64-linux-gnu/dri for 64-bit video drivers, but the system only has 32-bit mesa drivers.vmwgfx_dri.so / swrast_dri.so in the folder /usr/lib/i386-linux-gnu/driHere’s the steps to fix that.
To update the Raspberry Pi OS in VMWare to have the correct drivers, first start by doing a global update.
sudo apt-get update
sudo apt-get upgrade
Next, install the open-vm-tools, xserver and mesa drivers
sudo apt install -y \
open-vm-tools-desktop xserver-xorg-video-vmware \
libgl1-mesa-dri:i386 libglx-mesa0:i386 libglapi-mesa:i386 \
libegl1:i386 libegl-mesa0:i386 libgbm1:i386 libgles2-mesa:i386 \
mesa-utils
This puts the proper DRI .so drivers (vmwgfx_dri.so, swrast_dri.so) into /usr/lib/i386-linux-gnu/dri which Chromium (not Google Chrome) can load.
Reboot the Guest OS after this step so that drivers are properly loaded.
Verify the drivers exist with the following command:
ls /usr/lib/i386-linux-gnu/dri | grep vmwgfx
and confirm acceleration works:
glxinfo | grep "OpenGL renderer"
# should say: SVGA3D; build: RELEASE; LLVM;
Once those files exist, Chromium can be loaded with the following flags:
which chromium
 # for me, reports /usr/bin/chromium
/usr/bin/chromium --ignore-gpu-blocklist --enable-webgl
Finally, verify inside the browser by visiting chrome://gpu and https://webglreport.com/
Note: Passing the flag
--ignore-gpu-blocklistis essential as Chromium ignores the VMWare 3D driver on load. This and--enable-webglforces Chromium to load drivers and therefore hardware acceleration for WebGL

Shazzam! Now we’re ready to try out some real-time JavaScript Charts on a Raspberry Pi in VMWare.
OK now we have a working Raspberry Pi OS in VMWare which supports WebGL, we can test out the SciChart.js Realtime JavaScript Chart demos.
In Google Chrome in your R-Pi Guest Os, navigate to https://scichart.com/demo/. This should open up the demo gallery (defaulting to React charts).

You can scroll up/down and browse the example gallery.
Let’s pick one of the performance demos such as scichart.com/demo/react/chart-performance-load-one-million-points
This demo creates a line chart with 1,000,000 data-points and renders the chart. It will regenerate the data and re-render the chart in a timer loop to show how quickly SciChart.js can draw on this device. To pause the loop click the Pause button. To force a refresh (single frame), click the reload button.

The demo reports some performance numbers at the bottom. Generating and appending data takes 10ms and Rendering the frame takes 6ms on Raspberry Pi OS in VMWare. Pretty impressive numbers for a Linux VM with just 4GB ram!
This should show the speed and power of SciChart.js for low-cost low-power embedded hardware. An effective, viable option for big-data or real-time scientific charts on the Raspberry Pi.
Let’s try a couple of other examples.
The React Vital Signs ECG/EGK Medical Demo showcases a ECG waveform such as found in a medical vital signs monitor. This makes use of the fifoCapacity and fifoSweeping flags in SciChart.js to get a sweeping ECG effect – when the trace touches the right edge of the viewport, it wraps around to the left edge. You can learn more about fifoSweeping here.

This runs pretty well, with very smooth performance on Raspberry Pi OS on VMWare when using WebGL Hardware acceleration.
Using embedded hardware like a Raspberry Pi is perfect for medical devices, medical test devices and small portable vital signs monitors, blood pressure monitors and more. With SciChart.js you’ll get the performance and flexibility you need to create real-time charts on these platforms.
A Phasor Diagram is a graphical representation used in electrical engineering to visualize the magnitude and phase relationships of sinusoidal (AC) signals, particularly voltages and currents.
Common uses of Phasor Diagrams include AC Circuit analysis, power systems – analysis and visualisation of electrical grids, electric machines such as transformers, synchronous motors and generators, induction motors – signal modulation and demodulation in electronics, communications (e.g. AM, FM, PM) and representation of complex impedance and filters.
Using the JavaScript Phasor Diagram demo you can preview a JavaScript / React version of a real-time phasor chart on a Raspberri Pi. Perfect for analysis of electrical/electronic systems on low-cost embedded devices.

A real-time heatmap chart is a powerful visualization tool that is used in scientific, electronic/electrical, or RF engineering contexts to display how data evolves over time and space. It uses colour intensity to represent the magnitude of a variable across two dimensions, with the third dimension typically being time.
Heatmaps display values as colours in a 2D grid. A real-time heatmap updates continuously as new data arrives. Colour can be used to represent signal intensity, temperature, power level etc… in electronic/electrical engineer, RF engineering or spectral analysis.
The Rich Interactions Showcase demo on the SciChart.js website showcases a real-time updating heatmap, performing a double-slit experiment. All entirely in JavaScript and in this case, running on Raspberry Pi OS on VMWare.

In an industrial context, heatmaps are used to visualize spatial data from sensors or imaging systems, especially when inspecting physical materials or structures. One powerful use case is in non-destructive testing (NDT)—such as detecting stress fractures in concrete using ultrasound.
Using SciChart.js you can visualise Ultrasound devices, using a combination of polar-arc charts and heatmaps. This medical ultrasound demo below shows exactly how you can do this in JavaScript on a Raspberri Pi.

2D Charts not enough to visualise scientific data on a Raspberry Pi? You can also visualise 3D charts such as Surface Mesh plots, 3D point clouds, 3D Scatter/Bubble charts, 3D waterfall charts and 3D column charts using SciChart.js.

Go ahead and try out some more examples/demos of our Realtime JavaScript Charts at scichart.com/demo.
Again, note that the Raspberry Pi OS on VMWare doesn’t support WebGL by default. You’ll have to do some setup configuration as covered in Part 1 to enable WebGL (software emulation using Google Chrome, or hardware acceleration in Chromium) so that you can try out the SciChart.js demos.
A real Raspberry Pi 4 or 5 device has a GPU capable of hardware acceleration for WebGL 1 and 2, which means SciChart.js is fully supported by these devices. Something you can check by navigating to
chrome://gpuin the browser.
Simulating Raspberry Pi OS in VMWare Player is a practical solution for developers and engineers who want to prototype or test applications for embedded systems without needing physical hardware. Despite the limitations of virtualized hardware acceleration, it’s still entirely possible to run real-time JavaScript charts using SciChart.js – and achieve impressive performance even with software-emulated WebGL.
This setup is particularly relevant for industries working with HMI, SCADA, industrial automation, telemetry, and IoT monitoring, where lightweight, responsive, and visually rich dashboards are essential. Whether you’re evaluating charting solutions for edge devices or validating application logic in a virtual environment, this workflow gives you a solid head start.
When you’re ready to deploy to real Raspberry Pi hardware, you can expect even better performance – with full GPU acceleration enabling high frame rates and smooth data visualization.
If you’re working in embedded systems and need fast, high-performance charting on embedded systems, SciChart.js is a powerful option worth considering.
Recent Blogs
![]()
Queens Award for Innovation
Proud winners of the Queens Award for Innovation, 2019. Awarded on account of our innovative graphics engine which underpins the SciChart library and enables our world-beating charting performance
![]()
National Business Awards
Highly Commended for Lloyds National Business Awards, 2019. Awarded on account of our innovative graphics engine and impressive customer base
![]()
National Technology Awards
Awarded “Healthcare Tech of the Year” at the 2025 National Technology Awards – a top UK recognition for breakthrough innovation in technology.

Reviews
SciChart has received hundreds of verified, 3rd party reviews