Building a Smith Chart in JavaScript: Inside the Rendering Pipeline
See how SciChart.js was extended to build a fully interactive Smith chart using standard APIs. This article highlights the flexibility of custom rendering and advanced interactions.
Our team has been working hard on continued R&D with SciChart.js – High Performance JavaScript Charts – and today we’d like to announce that SciChart.js v6 is in Alpha and ready for testing.
In SciChart.js v6 we’ve unified the C++ engine shared across our platforms (WPF, iOS, Android) and multi-targeted it with Emscripten to compile against both WebGL and WebGPU. On browsers that support WebGPU this brings some significant performance improvements – most dramatically for dashboards with many live charts on screen at once. There’s a demonstration below.
Everything runs on the same rendering codebase, so WebGPU is not a separate product or a rewrite. Where WebGPU is available, SciChart.js uses it; where it isn’t, it falls back to WebGL automatically. Your chart code doesn’t change.
WebGPU is the successor to WebGL – a modern browser graphics and compute API that maps directly onto the GPU APIs native apps already use (Direct3D 12, Metal and Vulkan) instead of the older OpenGL ES model WebGL was built on. As of late 2025 it ships enabled-by-default in Chrome, Edge, Firefox and Safari, so it’s now a realistic production target rather than an experiment.
Two things make it interesting for charting specifically. First, it was designed around modern GPUs from the ground up, with lower CPU overhead and batched command submission. Second – and this is the part that matters most for us – it removes an architectural bottleneck in WebGL that had nothing to do with raw rendering speed and everything to do with how many charts you can put on a page.
The honest answer for a single well-optimised chart is: WebGL was already fast, and for one chart the two are broadly comparable. SciChart.js has rendered hundreds of millions of points on WebGL for years.
The real unlock is multiple live charts on one page.
Browsers limit the number of active WebGL contexts: around 16 in Chrome. Go past that and the browser starts silently destroying the oldest contexts. So a real-time dashboard with 20, 30 or more live panels can’t simply create a WebGL context per chart. The standard workaround is to render everything through a single shared context and then read the pixels back for each panel: GPU → CPU → HTML5 Canvas, every frame. That readback stalls the GPU pipeline, and under a heavy multi-panel live load it’s exactly where frame rate goes to die.
WebGPU dissolves the problem. A single shared composites across many canvases with no per-context ceiling and no readback. Each panel draws straight to its own surface off the same device. That’s where the “incredible performance gains” in the title come from – not a bigger number on one chart, but the ability to drive dozens of live charts at a smooth frame rate without paying the readback performance cost.
On top of that, WebGPU brings first-class compute shaders, opening the door to running work like data processing and render transforms directly on the GPU. That’s a direction we’re actively exploring for future releases.
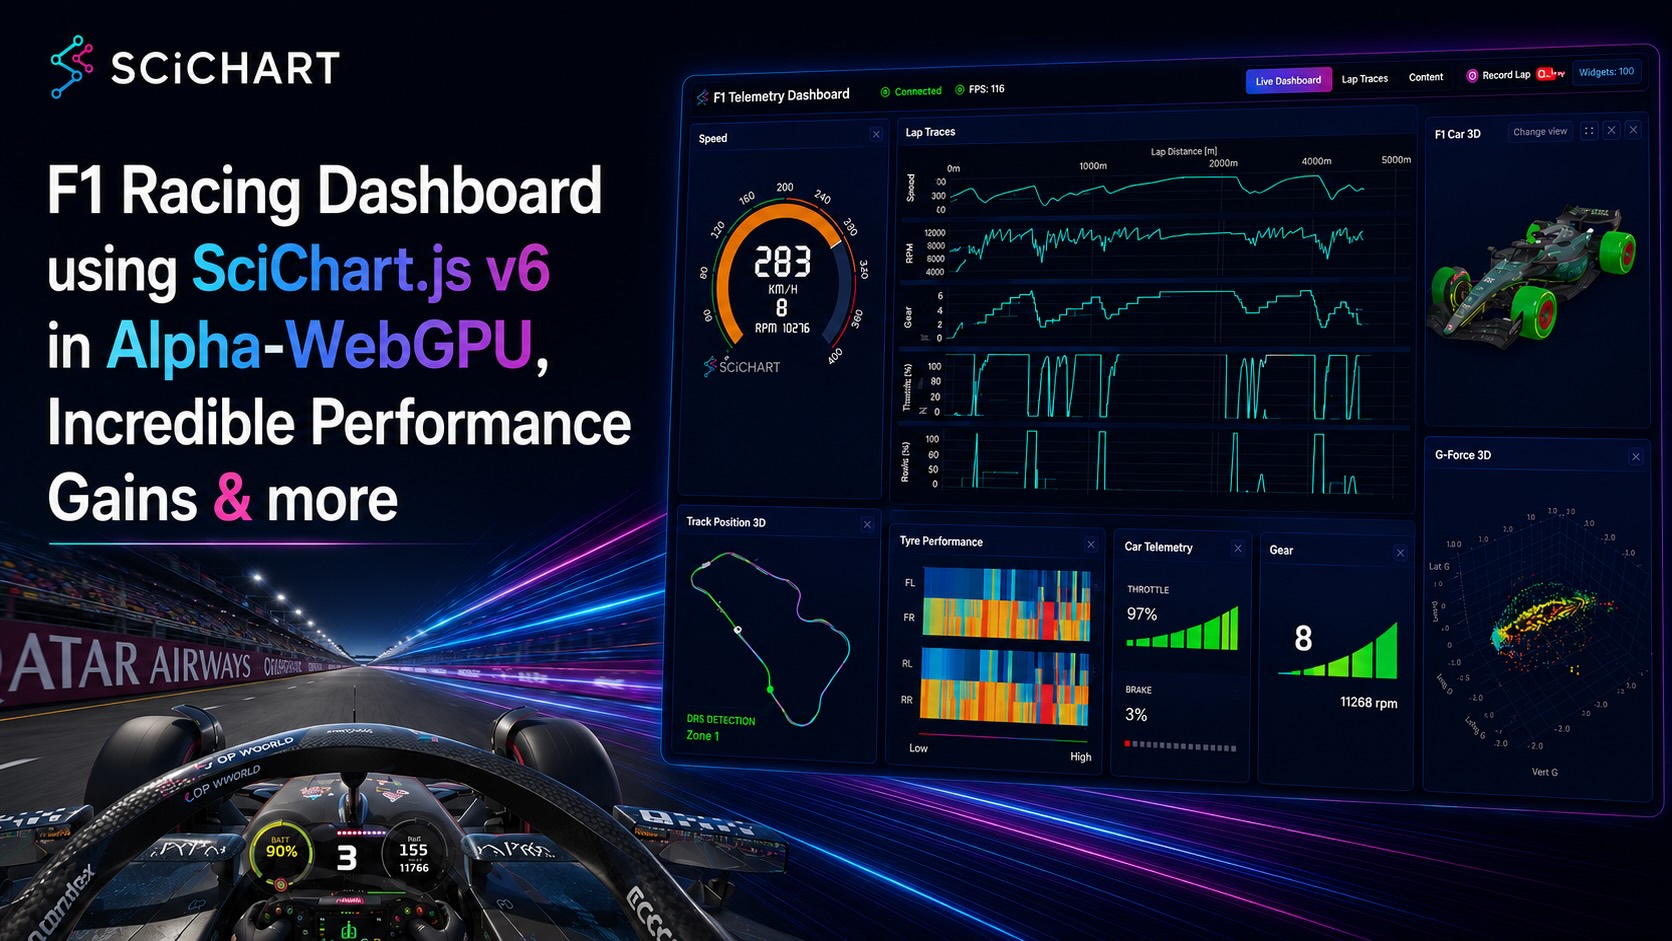
To show what this looks like in practice, we’ve built a real-time F1 Racing Dashboard / IoT telemetry demo: 30+ live charts updating simultaneously, in a single browser tab, on a 49″ super wide monitor (5120 x 1440 pixels), at frame rates in excess of 60fps – the exact multi-panel scenario that punishes the WebGL readback path.
Above: F1 Racing Telemetry Dashboard demo using SciChart.js v6, WebGPU and a custom telemetry broker. We’ve tested this on a MacBook Pro with 25 panels, over 30 live charts form Heatmaps to Scatter plots, Line charts, Gauges and 3D models of the F1 racing car to stress test SciChart.js in a real-world demonstration.
SciChart.js v6 will auto detect and use WebGPU by default if your browser supports it. However, it is possible to force a fallback to WebGL mode by setting the local storage setting IS_WEB_GPU = 0.
By forcing this setting and falling back to WebGL mode we can immediately see the performance gains brought by WebGPU in multi-panel dashboard scenarios:
Once WebGPU took charting off the critical path, the bottleneck moved. With 30+ panels painting comfortably at 60+ fps, the thing most likely to drop a frame was no longer the renderer – it was getting the data to all of them cleanly in the first place. A live dashboard is a fan-out problem: one firehose of incoming telemetry has to drive dozens of independent charts, every frame, without any one of them stalling the others.
So the demo has a small telemetry broker stack behind it. The flow looks like this:
The important idea is decoupling. The rate the data arrives at, the number of panels subscribed to it, and the rate the screen refreshes are three separate things, and the broker keeps them separate. Charts append their new data directly from the shared buffers with no per-sample copying and no round-trip through the UI framework’s state – the data goes to SciChart.js, not into React. That’s what lets the panel count grow without the per-frame cost growing with it.
It also comes for free with a useful side effect: because those buffers hold the full session, replaying a lap is just the same data delivered from a moving cursor. Every chart scrubs through a recorded session in perfect sync, using exactly the same code path it uses live.
Above: The replay control built in to the F1 Racing Dashboard Demo using SciChart.js. With all the data correctly handled by a telemetry broker, you get full live reply as a free side effect. Allowing teams to scrub through historical data and focus on specific timestamps at a glance.
None of this is WebGPU-specific – the broker doesn’t know or care which backend the engine is using. But it’s the other half of the story. WebGPU removed the ceiling on how many charts you can paint at once; the telemetry broker makes sure all of them have fresh, frame-aligned data to paint. You need both to run a dashboard this dense at this frame rate.
It’s worth being blunt about why this demo works at all, because it’s easy to look at the telemetry broker and conclude the data plumbing is the clever part. The plumbing matters – but it’s in service of the last stage, and the last stage is the one that’s hard. Every millisecond the telemetry data handling saves is wasted if the charts can’t draw inside the frame.
Consider the budget. Sixty frames a second means 16.7 milliseconds per frame – and that budget is not per chart, it’s for the entire page. Into those 16.7 ms you have to fit draining the telemetry buffers, updating every series, and letting the browser composite the result, across all 30+ panels, filling a 5120 × 1440 monitor (7.4 million pixels) every single frame. Divide it up and each chart’s slice of the frame is a fraction of a millisecond. A charting component that takes “only” a few milliseconds to redraw is perfectly fine on its own and completely fatal here: thirty of them at a few milliseconds each blow the frame budget many times over, and you’re locked at single-digit frame rates no matter how good your data layer is.
This is the part that doesn’t show up when you evaluate a chart libraries performance with chart. Most libraries look fine with one chart on screen – the cost only becomes visible when it’s multiplied by thirty and forced onto a shared 16.7 ms clock. A component that re-lays-out and repaints on the CPU each frame (the SVG, Canvas2D and DOM-based approach most general-purpose libraries take) simply has no path to these numbers; the work grows with both the number of panels and the amount of data on each, and the CPU falls behind almost immediately. The demo would stall out at a handful of live charts, and you’d never even reach the point of stress-testing the broker.
What makes it possible is a charting engine built for exactly this: SciChart.js provides GPU-accelerated rendering, a retained scene that appends new samples rather than rebuilding the chart from scratch each frame, and per-frame cost that stays flat as the underlying data set grows into the millions of points. That’s the difference between a chart that’s fast and one that’s fast enough to have thirty of them on screen at once.
It’s also why the WebGL context ceiling – around 16 live contexts before the browser starts destroying them – is such a hard wall: even a genuinely fast per-chart renderer can’t get 30+ panels onto the GPU under WebGL without the readback workaround, and the readback is what kills the frame rate. WebGPU’s shared GPUDevice removes that ceiling, and a rendering engine fast enough to exploit it is what turns “30+ live charts at 60fps” from a claim into a running demo.
That’s the honest framing of this whole project. The SciChart.js F1 Dashboard Demo is a real-time telemetry app on the surface, but underneath it’s a forcing function for the charting component – a workload deliberately built to break anything that isn’t fast enough. The broker makes sure the data is never the excuse. Everything left is the renderer, and that’s exactly where we wanted the spotlight.
SciChart.js v6 Alpha is available now for testing, with automatic WebGL fallback so existing projects keep working unchanged. We’d love your feedback – particularly from teams running dense, real-time dashboards.
Try it now, by using npm install scichart@6.0.0-alpha.133 or npm install scichart@alpha to always get the latest.
We’re taking feedback now from our customers, and would be interested to hear of any regression issues in updating from SciChart.js v5 – v6 that we can work on.
The SciChart.js F1 Racing Dashboard demo is currently closed source, however if you or your team would like a live demo to showcase what SciChart can do in a realistic IoT Telemetry workload, contact us to arrange it!
Recent Blogs
![]()
Queens Award for Innovation
Proud winners of the Queens Award for Innovation, 2019. Awarded on account of our innovative graphics engine which underpins the SciChart library and enables our world-beating charting performance
![]()
National Business Awards
Highly Commended for Lloyds National Business Awards, 2019. Awarded on account of our innovative graphics engine and impressive customer base
![]()
National Technology Awards
Awarded “Healthcare Tech of the Year” at the 2025 National Technology Awards – a top UK recognition for breakthrough innovation in technology.

Reviews
SciChart has received hundreds of verified, 3rd party reviews