Understanding the rendering challenges behind real-time, scientific, financial and mission-critical visualisations and how modern GPU-accelerated engines like Vx™ meet these challenges.
Performance in data visualisation is one of the most misunderstood concepts in modern software engineering.
Ask most developers what “high performance charting” means, and you’ll hear the same answer:
“How many data points can the chart draw?”
Raw data points on screen, while easy to measure, are one of the least sophisticated indicators of real performance. In real-world systems, performance affects everything:
Hardware cost per unit
Battery life and heat generation
UI responsiveness
Streaming throughput
Ability to run background analytics and processes
Data fidelity and accuracy
Feature richness
Scalability across project phases
Long term product viability
High-performance data visualisation is not simply about drawing more points. It is about building a scalable, deterministic, GPU-accelerated rendering system capable of handling the complexities of real-world applications in demanding fields such as finance, MedTech, aerospace, defence, scientific instrumentation, energy, and telehealth, across desktop, mobile, web, and embedded devices on platforms from iOS to Linux.
This article breaks down what high performance really means, the engineering challenges behind it, and how SciChart’s Visual Xccelerator™ (Vx) engine uniquely addresses these challenges through GPU acceleration, SIMD vectorisation, float64 precision, lossless adaptive resampling, a cross-platform C++ architecture, and dynamic rendering algorithm selection.
1. Why High Performance Data Visualisation is widely misunderstood
Most chart libraries simply don’t define performance, and those that do use simplistic benchmarks:
Plot a million points
Measure FPS
Claim fastest chart
This approach ignores the complexity of building mission-critical visualisation systems. In modern applications, performance isn’t a vanity metric; it’s a system-level requirement. A truly performant engine must handle:
Real-time ingestion of unsorted data from telemetry, instruments, sensors or trading feeds
Continuous user interaction (zoom, pan, scroll etc)
Complex analytical overlays, annotations, tooltips, multi-axis layouts without slowdown
Massive historical data windows down to nanosecond precision for orbital tracking systems or scientific experimentation
Low-power hardware constraints (tablets, industrial devices, medical devices, low cost devices and mobile devices in developing nations)
Browser and OS considerations
Scientific precision (Float64) across extreme zoom ranges
Streaming workloads where new data never stops
GPU orchestration, batching and multi-pass rendering with constant redraw events
Text, SVG, data, annotations, axis and legend interactions under dynamic use
A library that only focuses on “points on screen” will fail as soon as the workload becomes real.
2. A Modern Definition of High Performance in Data Visualisation
True high-performance visualisation requires optimisation across seven interconnected dimensions:
2.1 Rendering speed and frame latency
Raw FPS on simple use cases can often be misleading; it’s not enough to render fast, frame times must be consistent. Real systems fail when:
FPS fluctuates (often at re-draw events, or when handling unsorted data)
Garbage collection spikes occur
CPU load competes with analytics/models
UI thread blocking causes visible stutter
A stable 16ms frame time (60FPS) under heavy load with changing data input, or user interaction, is more important than achieving 1000 FPS in a synthetic test.
2.2 Real-time UI responsiveness
Users don’t understand the complexity of data visualisation and expect to see:
Instant zoom and pan
Zero lag brushing and filtering
Smooth transitions
Snappy overlays
When the UI stutters, user trust collapses, especially in trading, surgery and telehealth monitoring, real-time energy control rooms or aerospace and defence. In many sectors, the responsiveness and real-time interaction are mission-critical and are directly responsible for lives. UI responsiveness is a direct metric for trust, and complexity and interaction become proportional to usability and end user satisfaction.
2.3 Memory Efficiency
Modern hardware has limits:
Mobile devices aggressively kill high-memory apps
Embedded systems may have only 256MB – 1GB available
Browsers enforce strict memory ceilings
Industrial controllers run at extremely low power budgets
Multi-use applications run simultaneous processes with their own memory requirements
A true high-performance data visualisation solution must maintain performance, without exhausting memory.
2.4 CPU and GPU utilisation
Many chart libraries run on the CPU, often single threaded but this becomes a bottleneck at scale. Modern visualisation requires:
Offloading heavy lifting to the GPU
Parallelised data transforms
Batching draw calls
Minimising CPU – GPU round trips
SIMD vectorisation of coordinate transforms
Multi-threading pre-processing
If the chart engine competes with your analytics workload, your system loses, resource cost increase and usability drops.
2.5 Ability to handle real time or streaming data
Real-world data is no longer static. Time-series databases and streaming platforms are now standard building blocks for monitoring and analytics in IoT, system performance, and financial markets.
But even if your storage and transport layers are optimised, the charting engine still has to cope with high-throughput, real-time streams. A high-performance data visualisation layer must handle:
Tick-level market data
Spectrum Data
Continuous live ECG/EEG telemetry
Radar/Sonar systems
Sensor fusion from IoT or aerospace devices
Predictive modelling overlays
Complex interactions, user behaviour and through chart behaviour for simulation
If rendering blocks ingestion or forces downsampling that discards critical information, the entire system degrades, and the value of your expensive hardware and databases is undermined.
Learn more:
Time-series database resources papers describe ingestion rates for telemetry, market data and sensor networks, illustrating the need for high-throughput visualisation layers. Timescale Resources Influx Resources kdb+ Resources
2.6 Precision and numeric stability (float64)
Many engines use float32 to boost performance for drawing coordinates, but float32 suffers from:
Loss of precision at extreme zooms
Drift in cumulative transforms
Inability to represent large/scientific/scalar ranges
Rounding errors in analytical overlays
SciChart uses float64 (double precision) across the entire rendering pipeline to ensure:
Scientific accuracy
Financial grade precision
Mathematically stable axes
Consistent results across platforms
This is essential in aerospace, nuclear instrumentation, quantitative finance and energy monitoring. Accounting for these requirements, and leveraging alternative performance techniques ensures performance, accuracy and stability across use cases.
Science and engineering datasets do not scale linearly. At 1m, 10m, or 100m points, brute force rendering collapses. Dynamic algorithm selection allows SciChart to choose the most efficient rendering strategy based on:
Data density
Sorted vs unsorted data
Real-time throughput
Chart type
User zoom level
Precision requirements
Hardware capabilities
Browser limitations
This approach is foundational for real scalability and the practical limitations of the applications, devices and implementations.
3. The hidden complexities behind real-time visualisation
Most visualisation systems fail because they underestimate the cost of operations that seem trivial. Often, product owners have specialisms geared towards hardware where it’s believed that the complexity sits, later encountering difficulties in the software UI side, or hitting bottlenecks when requirements grow. The real challenges that typical charting solutions never consider are set out below
3.1 Coordinate transformations at scale
Converting millions of world-space coordinates into pixel-space coordinates cannot be done point-by-point in a loop without optimisation. Different methods need to be employed depending on the final implementation, examples include Cartesian to polar transformations, or Logarithmic scales. SciChart accounts for these and uses:
SIMD vectorised coordinate conversion
Branchless arithmetic where possible
Batched transformations
Cache-aware memory access patterns
This allows mapping millions of points per millisecond, with different algorithms and behaviours used for varying transformations, often done simultaneously across complex dashboards displaying data in different manners.
3.2 Managing overlays, labels, annotations and UI layers
Each of the following elements is computationally expensive and must be rendered, and often re-rendered on interaction:
Text labels
Axis tick marks
Gridlines
Cursors & tooltips
Interaction layers
Custom shapes
Alert markers
A truly engineered system must account for this and perform:
Partial redraws
Layered rendering
Intelligent batching
GPU acceleration of vector paths
Most chart libraries stumble here, not on the line plot itself. Complexity and performance is developed here, where user interaction triggers re-draw events, requiring a 100m data point series to update, whilst simultaneously coordinate transforms are occurring for a real-time polar chart display on screen, at the same time, on a separate chart surface, linked to the original chart type.
3.3 Handling real-world, imperfect datasets
Scientific, telemetry and even financial data often contain:
Non-uniform sampling
Out-of-order points
Time drift
Sudden bursts of millions of updates
Dead zones
Overlapping frequencies
SciCharts pipeline handles these cases while maintaining:
Visual integrity optimised for the use case
Performance
Deterministic update behaviour
A common issue arises in financial data sets where trading ceases on the weekend, inserting time frames absent of any data, quickly followed by market-opening high trading volume, accounting for these variations is critical to ensuring product stability.
3.4 Real-time updates and partial scene reconstruction
Redrawing the entire scene every frame is wasteful and consumes vital resources. To offset this, SciCharts Vx rendering uses
Dynamic redraw strategies
GPU layer reuse
Region-based invalidation
This ensures that only what must change is recomputed and enables truly optimised high-performance data visualisation. As a result, as requirements grow, the Vx engine can be optimised to handle the needs.
3.5 UI thread constraints
CPU-only charting, or poorly optimised GPU rendering competes directly with:
Business logic
AI models
Network polling
Storage operations
Rendering and layout
SciCharts C++ rendering engine is designed to reduce CPU and GPU pressure so developers can run more background processes or share resources where UI interfaces, or AI models are sharing hardware resources.
SciCharts’ advanced Vx rendering engine focuses on flexibility with the option to turn on or off advanced rendering techniques based on your needs.
4.1 When not to draw every point?
Drawing every point can be as unnecessary as Netflix streaming bitmap-quality frames at 60 FPS. It wastes:
Bandwidth
GPU resources
CPU cycles
Memory
Power
In many cases, more points do not equal more information for the human eye but doing this well is often too complex for most chart libraries. As a result, SciChart developed our own multi-award-winning lossless and adaptive resampling techniques, meaning that these advanced techniques can be toggled on and off, leaving data visually unchanged when this is required or beneficial.
4.2 The difference between resampling and decimation
Most “resampling” in chart libraries is actually crude downsampling or decimation (taking every 10th point).
This destroys:
Peaks
Troughs
Spikes
Rare events
Signal shape integrity
A trading signal, ECG waveform or scientific trace cannot tolerate such loss, and other non-specialised chart libraries don’t employ advanced techniques to prevent this; instead only being able to leverage cruder techniques such as decimation, or maintaining all data, at the cost of extra functionality or real-time updates unnecessarily.
SciChart implements a fast, purpose-built data compression algorithm tuned for high-performance visualisation, which can be enabled where appropriate. It:
Compresses millions of input points into thousands
Preserves the visual shape of the waveform
Retains peaks, troughs and rare events
Executes in milliseconds
Supports real-time streaming
Is effectively lossless for visual interpretation
At runtime, SciChart can select the optimal algorithm based on:
Dataset characteristics
Viewport Zoom level
Data density
Required precision
Hardware constraints
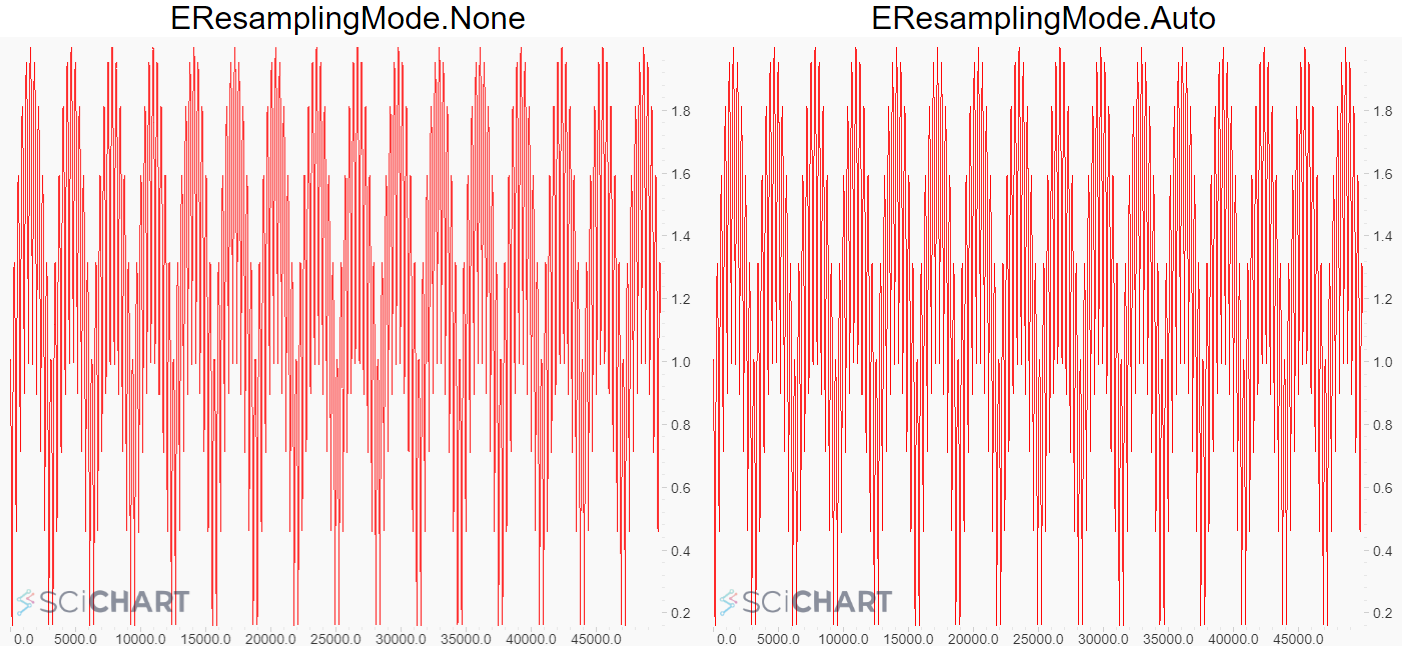
Above: Random walk data with and without resampling applied. All peak/trough information is preserved when resampling is applied.
Above: Noisy sinewave data with and without resampling applied. All peak/trough information is preserved when resampling applied.
The result is a chart that appears identical to “draw everything”, but is dramatically faster and lighter on CPU, GPU and memory, toggled on by users when appropriate, scaled subject to needs, and unique to SciChart.
5. Precision and stability: Why SciChart uses float64 (double precision)
Double precision is essential when:
Rendering large datasets at varying zoom levels
Combining real-time and historical data
Performing analytical overlays
Integrating with scientific or financial pipelines
To improve performance, some chart libraries rely on 32-bit pipelines; however, Float32 simply cannot handle:
Large time ranges
High frequency data with large offsets
Microsecond/Nanosecond level telemetry
Accurate zoom from macro-micro
Accumulated transformations
In simple terms, 32-bit numbers are 4 bytes, whereas float64 is 8 bytes. Chart libraries often sacrifice this fidelity for speed to get faster RAM – CPU transfers, faster buffer reads or to take advantage of GPU optimised mathematics. SciChart accounts for this and preserves accuracy whilst boosting performance through our smart double precision processing algorithms.
SciCharts float64 rendering pipeline ensures stability, accuracy, predictability and cross-platform consistency, being especially valued in: Financial charting, nuclear diagnostics, aerospace modelling, flight test data, medical telemetry and energy systems. Other solutions often make attempts to mirror this using BigInt or similar techniques, but ultimately lose the fidelity of a native float64 solution.
6. The Visual Xccelerator™ (Vx) Engine – SciCharts Proprietary Technology
Vx™ is SciCharts’ proprietary, cross-platform, GPU-accelerated rendering pipeline written in C++ for maximum determinism, efficiency and portability. It’s where our decades of high-performance data visualisation and low-level hardware architecture is embedded.
6.1 What Vx™ is
A GPU-accelerated, multi-stage rendering engine originating from gaming technology and adapted exclusively to data and text rendering, designed for:
Real time charting
Massive data sets
Scientific precision
Low power devices
Web
Mobile and embedded hardware
Aerospace, defence, Medtech, Finance and Scientific instrumentation
It replaces traditional CPU-bound rendering with a massively parallel GPU architecture, using advanced rendering techniques that can be tuned to sector and project needs. The engine absorbs the complexity of data rendering and hardware variation so that your application code doesn’t have to.
While modern game engines focus on rendering photorealistic scenes where exact numerical values are not critical, scientific and data visualisation requires mathematically precise, deterministic rendering where every point, axis and transformation must retain exact numerical fidelity across extreme scales.
6.2 Why GPU acceleration changes everything
GPU advantages include:
Thousands of parallel execution units
Extremely high memory bandwidth
Offloading work from the UI thread
Consistent frame times
Ability to run more background tasks
CPU only engines cannot compete under real world loads.
6.3 The multi-stage VX(™) rendering pipeline
Without exposing SciCharts’ Proprietary IP, the pipeline conceptually includes
Data ingestion: Efficient lock-free queues and buffers
SIMD vectorised coordinate transformation: Batch conversions as available
Adaptive, lossless resampling or alternate data transformation as required: Reduces or adapts the data set intelligently whilst preserving waveform shape
GPU batching and command stream generation: Minimises draw calls and state changes
Parallelised render passes: Line plots, fills, surfaces, annotations and text layers with custom behaviours developed for each
Composition and final output: GPU driven composition ensures smoothness and clarity
Chart Rendering Pipelines Diagram
6.4 Why C++ matters
Modern data visualisation solutions run across devices, hardware and operating systems with users requiring consistent look, feel and performance. Similarly, the range of complex interactions and use cases is so diverse that a rendering engine needs to be able to offer the highest level of customisation and the lowest level of direct instruction to the hardware. C++ offers:
Zero runtime overhead
Direct access to GPU APIs
Deterministic memory usage
Maximum control over instruction-level optimisation
Portability to WebAssembly, iOS/Android, Linux, Windows
Freedom from garbage collection stalls
In real terms, this means that SciChart has consistent performance across web, mobile, desktop, embedded and industrial controllers whilst preserving performance and increasing optimisations for complex applications. Without Direct access to GPU APIs, or by using higher-level and simpler languages, a charting component would lose the performance or complexity in exchange for a simpler rendering pipeline. This is why SciChart developed our own internal rendering engine.
Learn more:
Unreal and Unity engines use C++ for their internal rendering pipelines because deterministic performance, memory layout control, and hardware access are essential. Unreal Documentation Unity Documentation
7. Why most chart libraries cannot scale
Even libraries claiming high performance often rely on:
Brute force rendering
CPU-bound loops
Synthetic benchmarks
Single-threaded update pipelines
Linear cost redraws
Lack of adaptive algorithms
Float32 precision
Poor handling of overlays
No GPU acceleration
Open source, or simpler rendering engines in higher-level languages
These limitations make them unsuitable for:
Long term, scalable use
Real time environments
Scientific accuracy
Battery sensitive devices
Embedded hardware
Expanding product complexity
Cross-platform use
Projects with hardware cost considerations
Projects with multiple, simultaneous operations
SciChart avoids these pitfalls by engineering for real workloads
8. Performance as a product strategy
High performance data visualisation is not a feature; it is a force multiplier in modern technology. It enables:
Cheaper hardware (budget tablets, embedded devices, mobile devices)
Wider usage base (cheaper device costs = more market penetration globally)
Performance becomes a competitive differentiator, and not just through points on the screen.
9. Continual Optimisation
High-performance data visualisation is not something achieved once. Hardware, operating systems and customer workloads evolve continuously, especially on mobile, where new OS releases and GPU driver changes can introduce unexpected behaviour. A charting engine must be actively maintained and optimised to avoid silent regressions.
At SciChart, performance is treated as a first-class feature in every release cycle. Each major release undergoes profiling of the full rendering pipeline across real-world workloads in finance, MedTech, scientific instrumentation, defence and industrial systems. This includes extensive testing on mobile devices, where we validate behaviour across new iOS and Android versions, updated GPU drivers and varied device capabilities.
We maintain an expanding set of performance test suites that grow with every release. These include stress tests, multi-chart dashboards, annotation-heavy scenes and high-frequency streaming scenarios. New features are benchmarked against historical baselines to ensure there is no deterioration in frame time, memory usage or throughput. If a regression is detected, it is reworked until performance meets or exceeds the previous standard. You can read more about our security, quality and business continuity design ethos here.
Because SciChart runs on desktop, web, mobile, Linux and embedded environments, we validate across a wide range of CPUs, GPUs, devices and browsers. Many optimisations come directly from customer workloads such as high-frequency trading, Formula 1, nuclear fusion diagnostics and telehealth monitoring.
This continual optimisation is a core value of our updates and maintenance subscription. We handle the ongoing complexity of rendering performance, mobile OS changes and GPU driver behaviour so that engineering teams do not need to carry that burden internally.
The result is consistent. As SciChart evolves, it does not slow down. In many cases, users experience higher performance over time even as their dashboards grow in complexity. For organisations building long-lived, mission-critical applications, this ongoing optimisation is essential. Performance is never static, and our release process is designed with that reality at its core.
10. How to evaluate a “high performance” charting library
When you’re comparing charting libraries, ask:
Does it support GPU accelerated rendering, or is it CPU only?
Does it provide native float64 precision end-to-end or does it rely on float32?
How does it handle real-time streaming and unsorted data?
Can it use adaptive, lossless resampling or does it default to simple decimation?
Does it incorporate complex technologies and advanced techniques like lossless resampling, multi-stage adaptive pipelines, or does it shun these?
Can it keep UI interactions smooth under high data throughput?
Is the core engine written in a low-level language (e.g C++) that can be optimised, or is it Open Source or generic?
How does it perform with annotations, overlays, multiple axes and complex dashboards? Not just a single line chart benchmark?
Can you access source code?
If the answer to these questions is vague, or the benchmarks only show points on screen and simple examples, you’re not looking at a true high performance visualisation engine.
11. Conclusion
High performance data visualisation is not about drawing more points. It is the engineering foundation that determines whether your application is different from the next product on the market, and whether your application can:
Scale
Handle real-time loads
Maintain accuracy
Run on constrained hardware
Run on evolving or diverse hardware, consistently
Is affordable for your user base
Supports modern analytics
Delivers world class UX
Meets mission-critical reliability standards
Can be deployed in sensitive sectors such as Medtech or Defence
SciChart’s approach, built on GPU acceleration, low level development in C++, SIMD vectorisation, float64 precision, lossless adaptive resampling, dynamic algorithm selection and a cross platform rendering architecture, offers a fundamentally different level of performance and scalability.
Where traditional chart libraries focus on brute force rendering or sacrifice performance for accuracy, SciChart focuses on real world complexity. This allows companies in finance, MedTech, aerospace, defence, energy and scientific instrumentation to build products that are faster, more accurate, more scalable and more innovative.
In modern software, performance is not a luxury. It is the competitive advantage as long as what performance really means is understood.
If you’re evaluating performance-critical visualisations, speak to us
By Sheldon Vestey | Dec 03, 2025
Chief Commercial Officer at SciChart, with a background in Biochemistry & Genetics and serving as a Government Scientific Grant Assessor. Focuses on business development, building key partnerships, advancing customer innovations, leading educational programs, and managing reseller networks.
Queens Award for Innovation Proud winners of the Queens Award for Innovation, 2019. Awarded on account of our innovative graphics engine which underpins the SciChart library and enables our world-beating charting performance
National Business Awards Highly Commended for Lloyds National Business Awards, 2019. Awarded on account of our innovative graphics engine and impressive customer base
National Technology Awards Awarded “Healthcare Tech of the Year” at the 2025 National Technology Awards – a top UK recognition for breakthrough innovation in technology.
Reviews SciChart has received hundreds of verified, 3rd party reviews
Try SciChart Today
Start a trial and discover why we are the choice of demanding developers worldwide