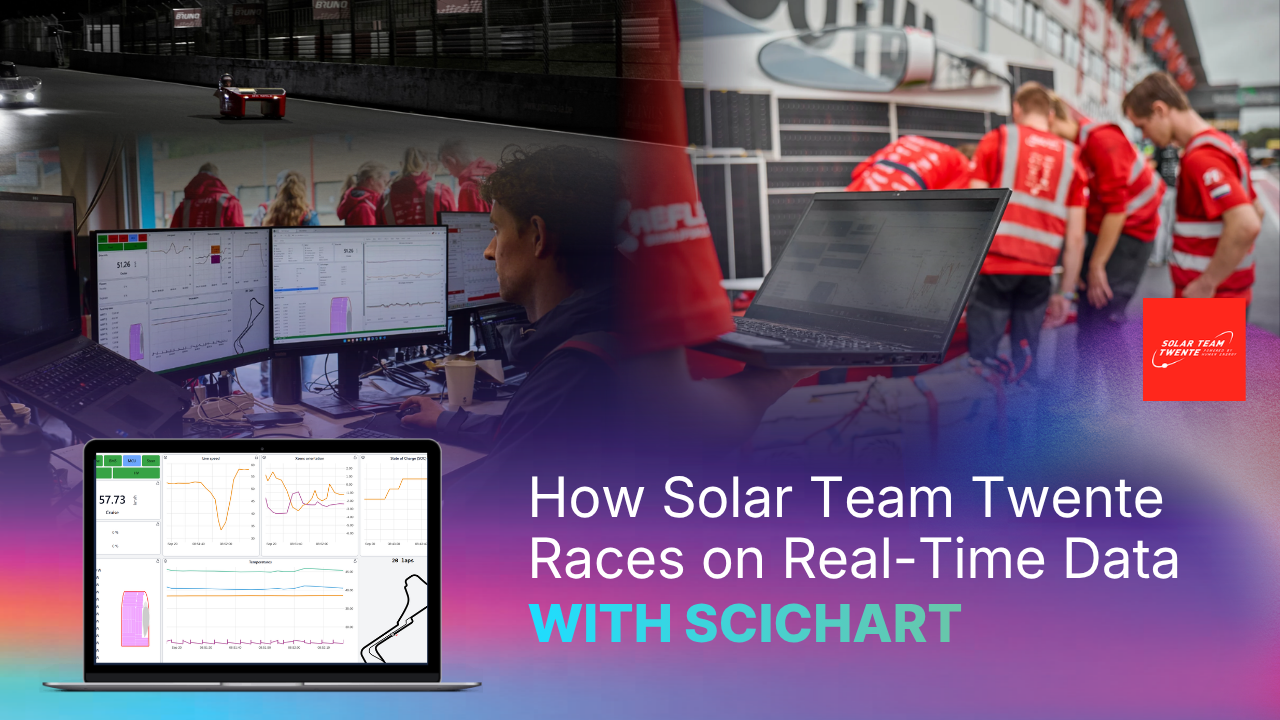
Customer: Solar Team Twente
Industry: Motorsport and engineering education
Platform: SciChart.js with Angular
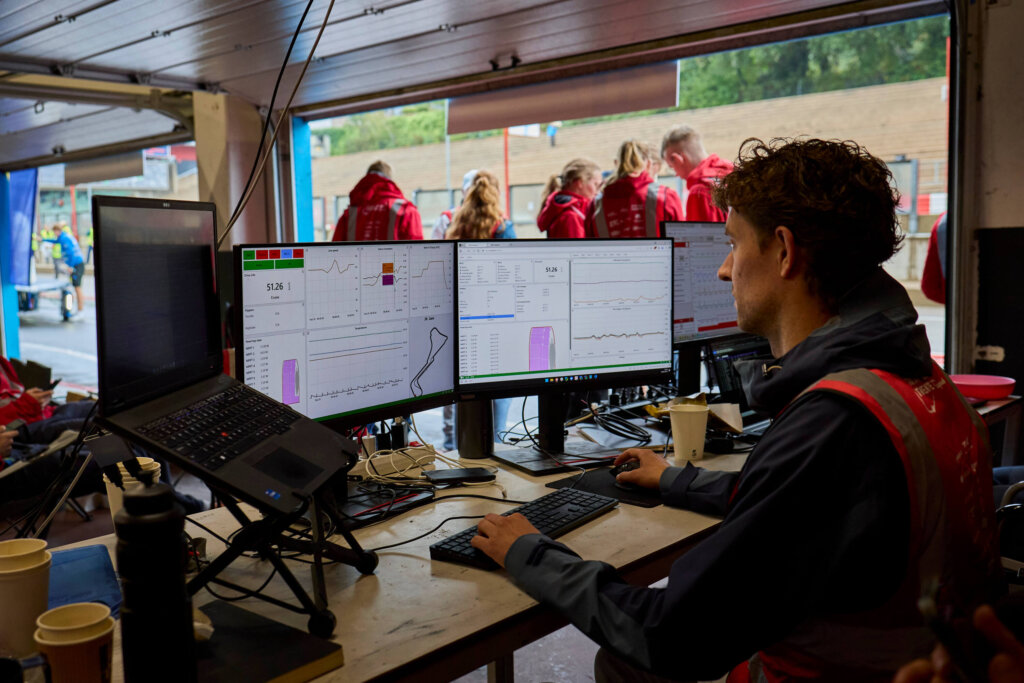
At Circuit Zolder in Belgium, a solar car disappears around the far side of the track. Only the driver can see what’s happening inside it. In the pit box, the rest of Solar Team Twente watches the data instead.
For 24 hours, the team based its decisions on what those charts showed. By the end of the race, it had driven 320 laps and taken first place.
Behind those charts is a set of live, historical, and strategic interfaces built with SciChart.js. Here’s how a student team from the Netherlands put them together.
Meet Solar Team Twente
Solar Team Twente is a student team from the Netherlands. It designs and builds cars that are powered solely by the sun. Each edition, around 25 students pause their studies for 12 to 18 months to work on the project full time.
The team has built a new car for every edition for more than 20 years. Each one brings new technology and refinements down to the smallest detail with the aim of building better cars than the competition.
Its calendar includes the Bridgestone World Solar Challenge in Australia, South Africa’s Sasol Solar Challenge, and Belgium’s European Solar Challenge.
The Bridgestone race is the one the team most wants to win. It covers 3,000 km of public highway across the Australian outback. The car runs every kilometer on its own solar power. It reaches the finish after about four and a half days.
Small Margins on Public Roads
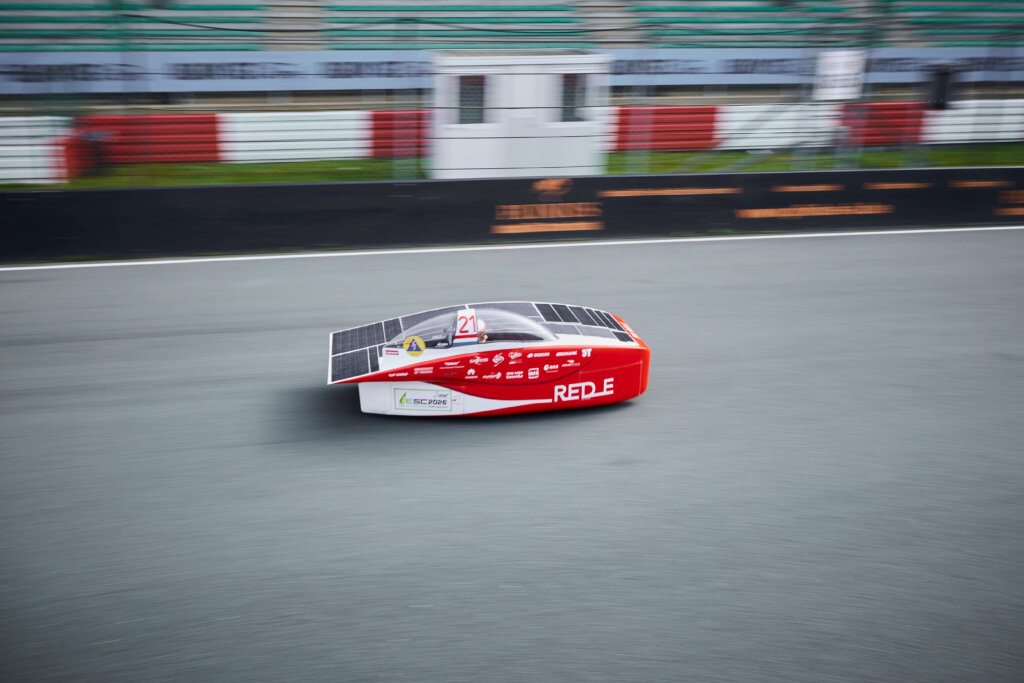
A solar car is a prototype, but it races on public highways. The gaps between the top teams are very small. To win, every detail has to go right.
The support car monitors every signal the solar car senses and produces, and that is where the team works out its race strategy. It calculates and predicts what’s likely to happen over the coming days.
All of this has to be shown in charts, and the demands vary. Some charts receive data at high frequency while others have to handle very large datasets.
In testing and in most races, around 250 data points arrive from the car every second, and a portion of them feed straight into charts. With the high-speed IMU setting switched on for testing, one chart takes motion data at 40 Hz. At the other end of the scale, the chart comparing the car’s actual energy against its expected energy carries around 40,000 points split across two lines.
The team had hit problems before. Its interfaces held many charts behind different tabs, all updating in the background by design. That setup caused memory issues and charts that didn’t render properly.
Switching Chart Engines
Before SciChart, the team used another JavaScript charting library, and it worked well enough. However, they encountered trouble with the license which meant it was no longer fit for purpose.
The search for a replacement led to SciChart.js, and once it was in, it turned out to be the better fit. Custom axes were easier to create, which matters when strategy charts plot data in unusual ways. Styling was simpler too, down to switching between dark and light themes.
Live, Historical, and Strategic Interfaces on One Chart Engine
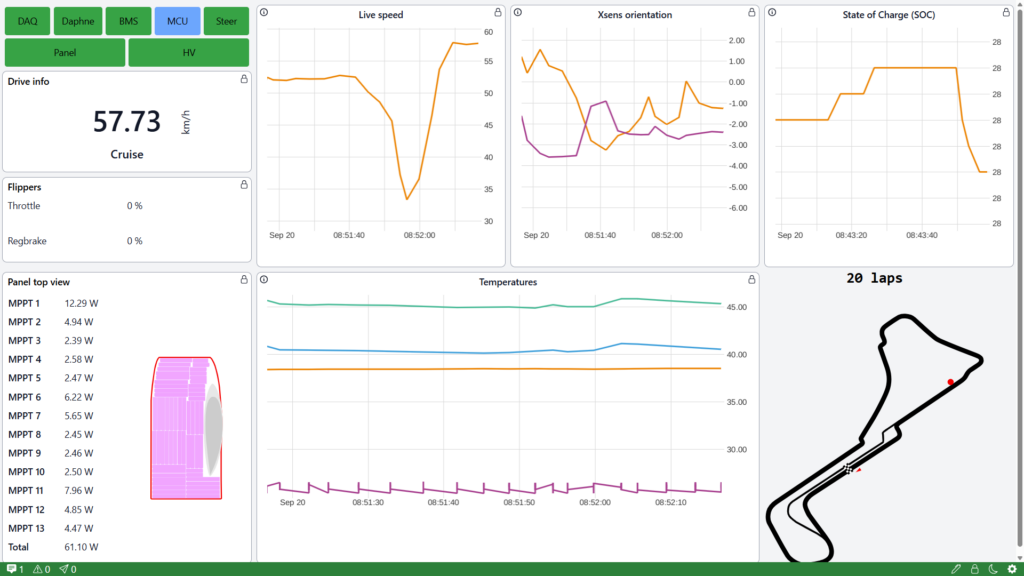
Solar Team Twente built multiple web interfaces, split into three groups: live, historical, and strategic. All of them are Angular interfaces built with SciChart.js. Each one was an Angular app built with SciChart.js. They connected to Python backends through API requests and WebSockets.
Data from the car arrived over local Wi-Fi and the team’s processing system sent the data on to each client.
Running in the browser was a deliberate choice. The race spans 3,000 km and involves many people in different locations. Browser-based interfaces let everyone work from whatever device they have, wherever they are.
If something fails, the team has to respond immediately.
The team mainly uses line and scatter charts, with strategy work sometimes calling for non-standard axes to plot ideas in new ways. SciChart’s API made this possible and helped the team build new charts.
Across those interfaces, 26 charts run at the same time. Some are simple. A few refresh the same 20 values on every update so the team can see how those values balance against each other at a glance. A chart is far quicker to read than a column of numbers.
Charts That Keep Updating in the Background
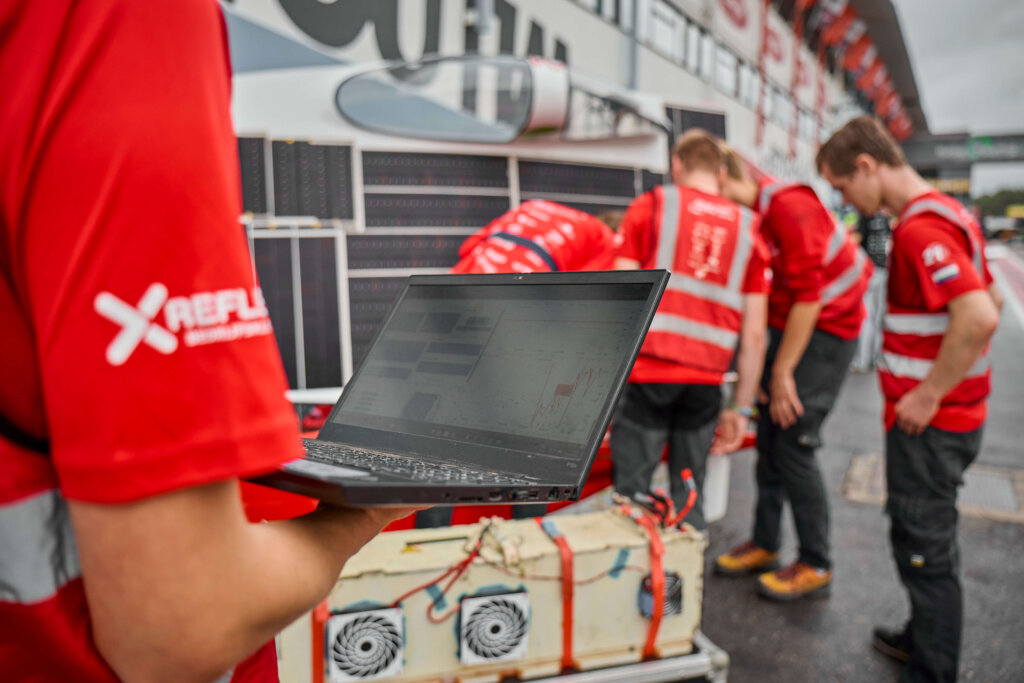
With SciChart.js in place, the background updates stopped being a problem. Charts across every tab now stay live without memory issues or rendering failures.
“Having SciChart as the chart engine makes all charts work smoothly. In the past, charts updating in the background caused memory issues or didn’t render properly. But not anymore!”
Jurre van der Schaaf, Data Acquisition and Software Engineer, Solar Team Twente
24 Hours at Circuit Zolder
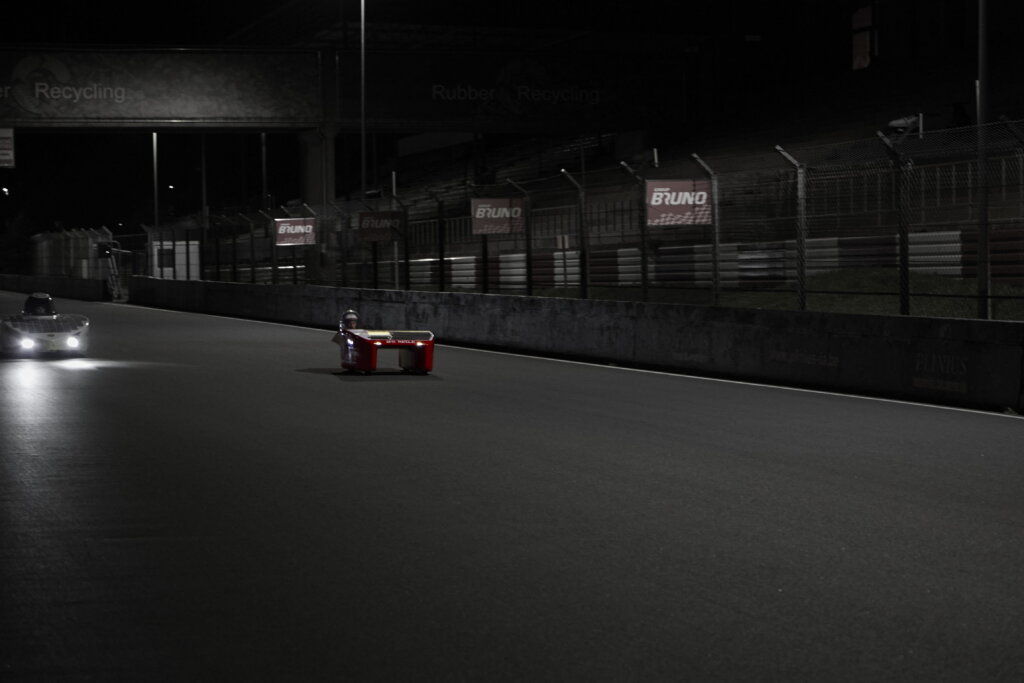
In 2026, the team raced the European Solar Challenge, a 24-hour event at Circuit Zolder in Belgium. They set up their Data & Strategy office in the pit box. The car sent data over 4G, which limited how often updates came through. The team usually works with around 250 data points a second. At Zolder, it received roughly 50 data points, once a second.
The charts still mattered. Once the car is on the track, the team can barely see it. Only the driver knows what’s happening, but the data gives insights to help get the car to the finish line first.
“We need to base all decisions on data.”
Jurre van der Schaaf, Data Acquisition / Software Engineer, Solar Team Twente
For the event, the team built new charts to combine data in new ways, something that was previously not possible due to a lack of flexibility and customizations. Each chart was designed specifically for circuit racing and this helped them to achieve faster laps.
Coaching Drivers Over the Radio
The chart the team leaned on most plotted power consumption against distance around the track.
Drivers swapped every two hours across the 24-hour race, and on a circuit, the person at the wheel has a big effect on how efficiently a solar car runs. The chart put each driver’s live data next to earlier stints from their teammates and data from the previous year. The strategy team could see exactly where a driver was using more energy than they needed to.
That turned into feedback over the radio. Every driver got a steady stream of tips on how efficiently they were driving, through every stint, for the full 24 hours. That is a long time to receive driving advice. The figures suggest the drivers listened, with the car running efficiently even at high speed.
“Having the data of different drivers and the previous year, but most importantly the live data, we could coach the current driver over the radio with continuous tips and feedback about how efficiently they drove.”
Jurre van der Schaaf, Data Acquisition / Software Engineer, Solar Team Twente
The Result
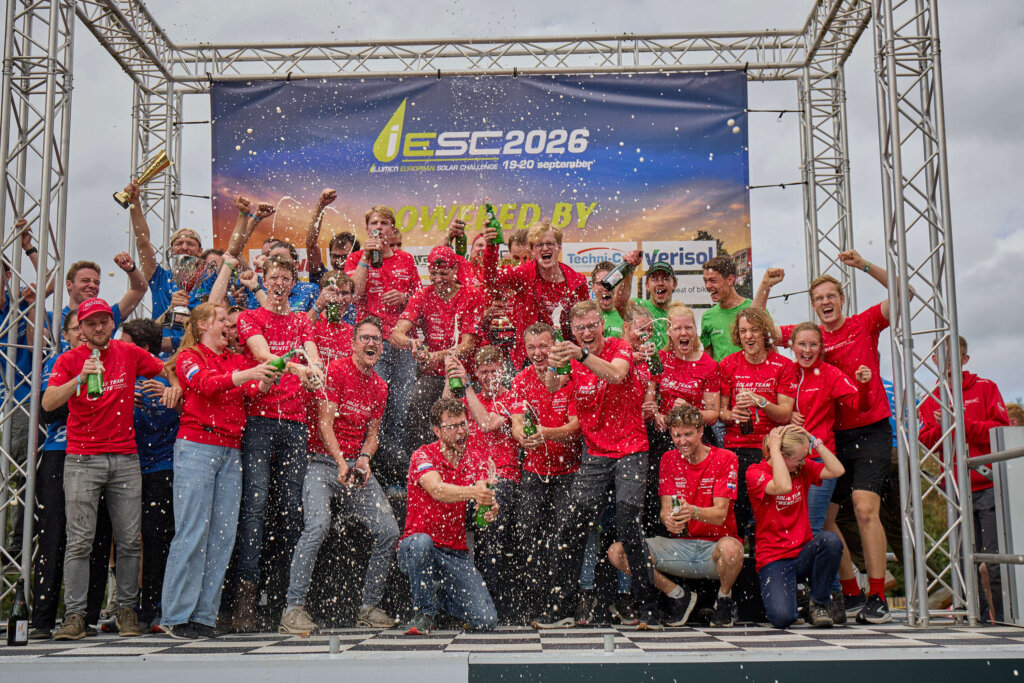
Solar Team Twente won the European Solar Challenge 2026. Over 24 hours, the car drove 320 laps, or 1,280 km. It set the fastest hot lap at 2:55.60.
The team scored the most points and took first place on the podium.
It was also a quiet race, in the best sense. Every system in the car worked as planned and nothing came up that the team hadn’t prepared for. For a data team, 24 mishap-free hours is about as good as it gets.
Why Solar Team Twente Uses SciChart
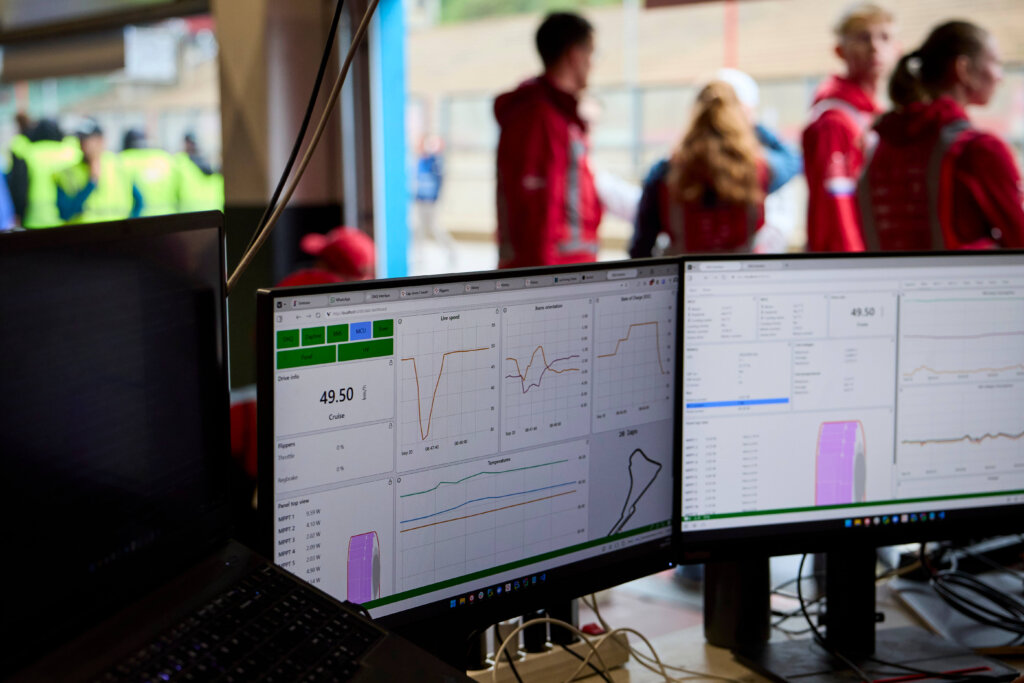
- Stable under load: 26 charts across multiple tabs keep updating without memory or rendering problems.
- Ready for high-frequency data and large datasets: One engine handles around 250 data points a second from the car and a 40,000-point energy chart. SciChart.js supports 1 billion data points per dataset.
- A flexible API: Custom axes for strategy charts were easier to build than in the team’s previous library, and new charts are quick to put together.
- Easy to style: Dark and light themes take very little effort to set up.
- Browser-based: The Angular interfaces move easily between devices, from the support car to the pit box.
SciChart for Motorsport Telemetry
From Formula Student to solar racing, engineering teams use SciChart.js to turn high-frequency motorsport telemetry into race decisions.
Student and non-commercial projects can start with the free SciChart.js community license.
Start SciChart.js Trial Get in Touch