SciChart® the market leader in Fast WPF Charts, WPF 3D Charts, iOS Chart, Android Chart and JavaScript Chart Components
SciChart Android ships with ~90 Android Chart Examples which you can browse, play with, view the source-code and even export each SciChart Android Chart Example to a stand-alone Android Studio project. All of this is possible with the new and improved SciChart Android Examples Suite, which ships as part of our Android Charts SDK.
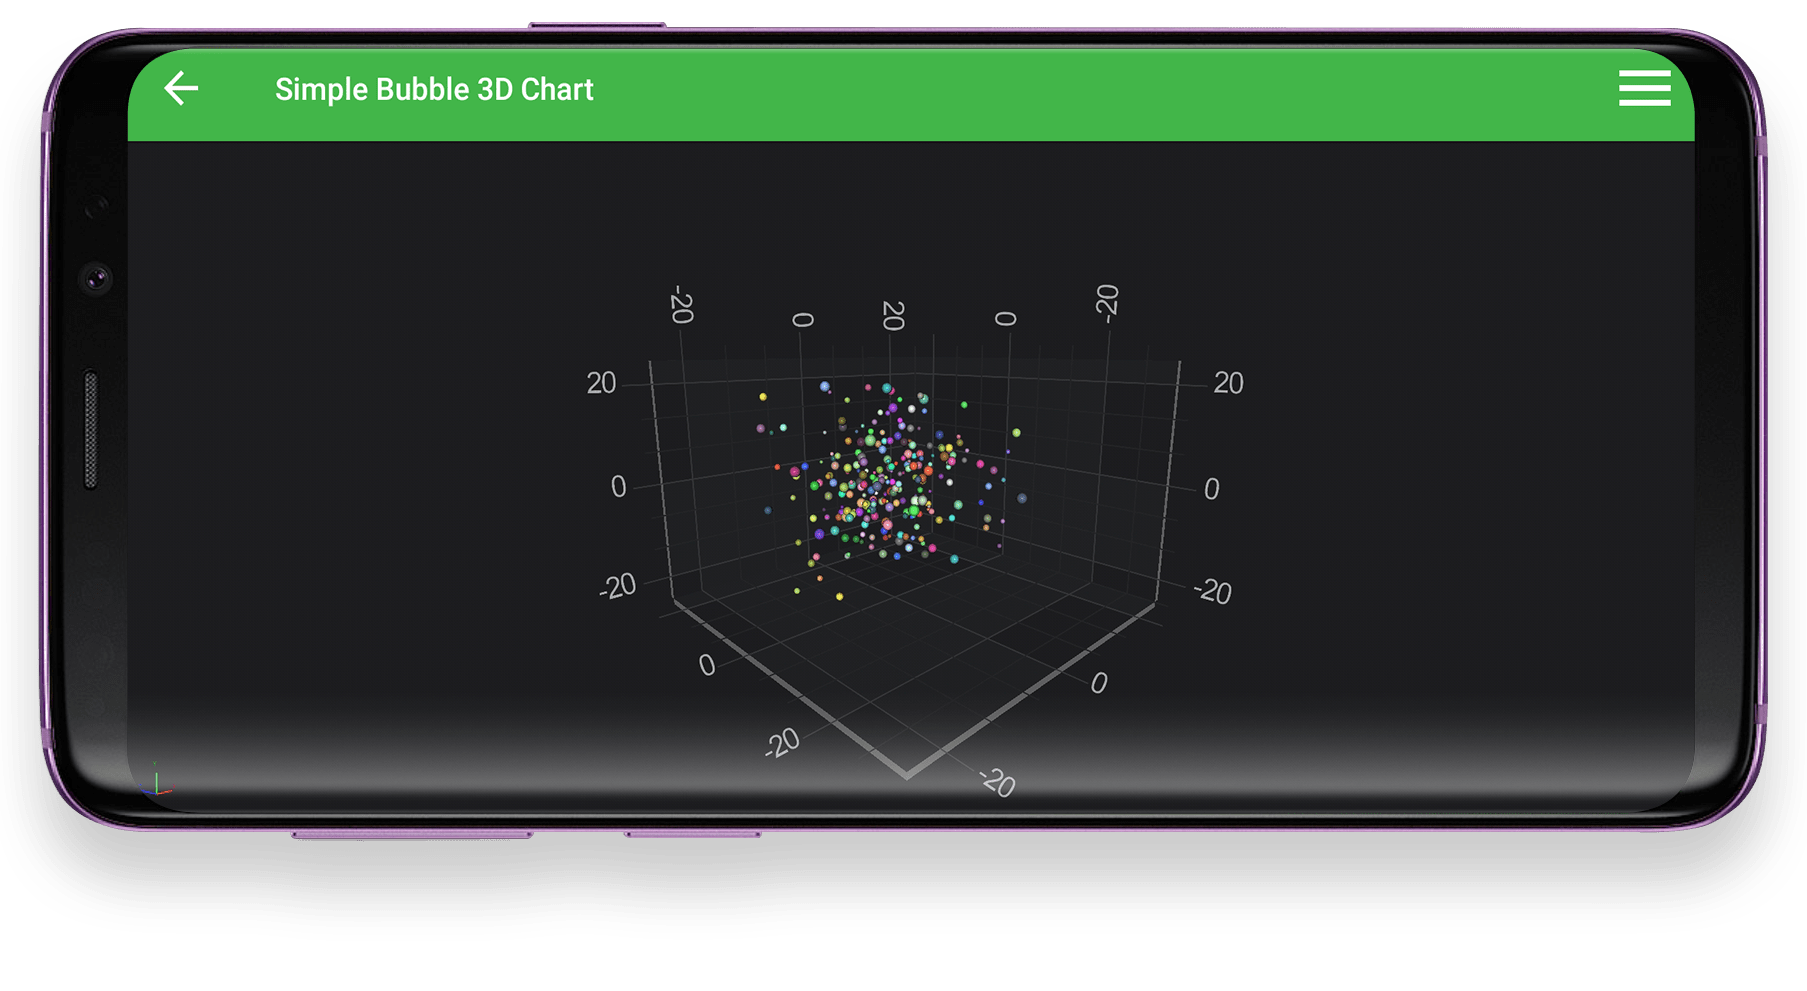
Demonstrates how to use ScatterRenderableSeries3D type and create a 3D Bubble Android Charts with SciChart Android Chart Library. The ScatterRenderableSeries3D requires a pointmarker, that defines a shape of scatters. ScatterRenderableSeries3D supports multiple types of pointmarkers for both in 2D and 3D. In 3D charts those include: SpherePointMarker3D, CubePointMarker3D, PyramidPointMarker3D, CylinderPointMarker3D.
You may also customize scatters’ Size and Colors.
Read more in the Android Scatter 3D Chart Type Documentation.
The full source code for the Android 3D Simple Bubble Chart example is included below (Scroll down!).
Did you know you can also view the source code from one of the following sources as well?
<?xml version="1.0" encoding="utf-8"?><!--*************************************************************************-->
<!-- SCICHART® Copyright SciChart Ltd. 2011-2018. All rights reserved. -->
<!-- -->
<!-- Web: http://www.scichart.com -->
<!-- Support: support@scichart.com -->
<!-- Sales: sales@scichart.com -->
<!-- -->
<!-- example_single_chart3d_fragment.xml is part of the SCICHART® Examples. Permission is hereby granted -->
<!-- to modify, create derivative works, distribute and publish any part of this source -->
<!-- code whether for commercial, private or personal use. -->
<!-- -->
<!-- The SCICHART® examples are distributed in the hope that they will be useful, but -->
<!-- without any warranty. It is provided "AS IS" without warranty of any kind, either -->
<!-- expressed or implied. -->
<!--*************************************************************************-->
<LinearLayout xmlns:android="http://schemas.android.com/apk/res/android"
android:layout_width="match_parent"
android:layout_height="match_parent"
android:orientation="vertical">
<com.scichart.charting3d.visuals.SciChartSurface3D
android:id="@+id/chart3d"
android:layout_width="fill_parent"
android:layout_height="fill_parent" />
</LinearLayout>
//******************************************************************************
// SCICHART® Copyright SciChart Ltd. 2011-2019. All rights reserved.
//
// Web: http://www.scichart.com
// Support: support@scichart.com
// Sales: sales@scichart.com
//
// CreateBubble3DChartFragment.java is part of the SCICHART® Examples. Permission is hereby granted
// to modify, create derivative works, distribute and publish any part of this source
// code whether for commercial, private or personal use.
//
// The SCICHART® examples are distributed in the hope that they will be useful, but
// without any warranty. It is provided "AS IS" without warranty of any kind, either
// expressed or implied.
//******************************************************************************
package com.scichart.examples.fragments.charts3d;
import com.scichart.charting3d.model.dataSeries.xyz.XyzDataSeries3D;
import com.scichart.charting3d.visuals.SciChartSurface3D;
import com.scichart.charting3d.visuals.axes.NumericAxis3D;
import com.scichart.charting3d.visuals.camera.Camera3D;
import com.scichart.charting3d.visuals.pointMarkers.SpherePointMarker3D;
import com.scichart.charting3d.visuals.renderableSeries.metadataProviders.PointMetadataProvider3D;
import com.scichart.charting3d.visuals.renderableSeries.scatter.ScatterRenderableSeries3D;
import com.scichart.core.framework.UpdateSuspender;
import com.scichart.drawing.utility.ColorUtil;
import com.scichart.examples.R;
import com.scichart.examples.data.DataManager;
import com.scichart.examples.fragments.base.ExampleBaseFragment;
import java.util.List;
import butterknife.BindView;
public class CreateBubble3DChartFragment extends ExampleBaseFragment {
@BindView(R.id.chart3d)
SciChartSurface3D surface3d;
@Override
protected int getLayoutId() {
return R.layout.example_single_chart3d_fragment;
}
@Override
protected void initExample() {
final DataManager dataManager = DataManager.getInstance();
final Camera3D camera = sciChart3DBuilder.newCamera3D().build();
final NumericAxis3D xAxis = sciChart3DBuilder.newNumericAxis3D().withGrowBy(.1, .1).build();
final NumericAxis3D yAxis = sciChart3DBuilder.newNumericAxis3D().withGrowBy(.1, .1).build();
final NumericAxis3D zAxis = sciChart3DBuilder.newNumericAxis3D().withGrowBy(.1, .1).build();
final XyzDataSeries3D<Double, Double, Double> xyzDataSeries3D = new XyzDataSeries3D<>(Double.class, Double.class, Double.class);
final PointMetadataProvider3D metadataProvider = new PointMetadataProvider3D();
final List<PointMetadataProvider3D.PointMetadata3D> medatata = metadataProvider.metadata;
for (int i = 0; i < 250; i++) {
final double x = dataManager.getGaussianRandomNumber(5, 1.5);
final double y = dataManager.getGaussianRandomNumber(5, 1.5);
final double z = dataManager.getGaussianRandomNumber(5, 1.5);
xyzDataSeries3D.append(x, y, z);
final int color = dataManager.getRandomColor();
final float scale = dataManager.getRandomScale();
medatata.add(new PointMetadataProvider3D.PointMetadata3D(color, scale));
}
final SpherePointMarker3D pointMarker = sciChart3DBuilder.newSpherePointMarker3D()
.withFill(ColorUtil.LimeGreen)
.withSize(2f)
.build();
final ScatterRenderableSeries3D rs = sciChart3DBuilder.newScatterSeries3D()
.withDataSeries(xyzDataSeries3D)
.withPointMarker(pointMarker)
.withMetadataProvider(metadataProvider)
.build();
UpdateSuspender.using(surface3d, new Runnable() {
@Override
public void run() {
surface3d.setCamera(camera);
surface3d.setXAxis(xAxis);
surface3d.setYAxis(yAxis);
surface3d.setZAxis(zAxis);
surface3d.getRenderableSeries().add(rs);
surface3d.getChartModifiers().add(sciChart3DBuilder.newModifierGroupWithDefaultModifiers().build());
}
});
}
}