SciChart® the market leader in Fast WPF Charts, WPF 3D Charts, iOS Chart, Android Chart and JavaScript Chart Components
SciChart Android ships with ~90Â Android Chart Examples which you can browse, play with, view the source-code and even export each SciChart Android Chart Example to a stand-alone Android Studio project. All of this is possible with the new and improved SciChart Android Examples Suite, which ships as part of our Android Charts SDK.
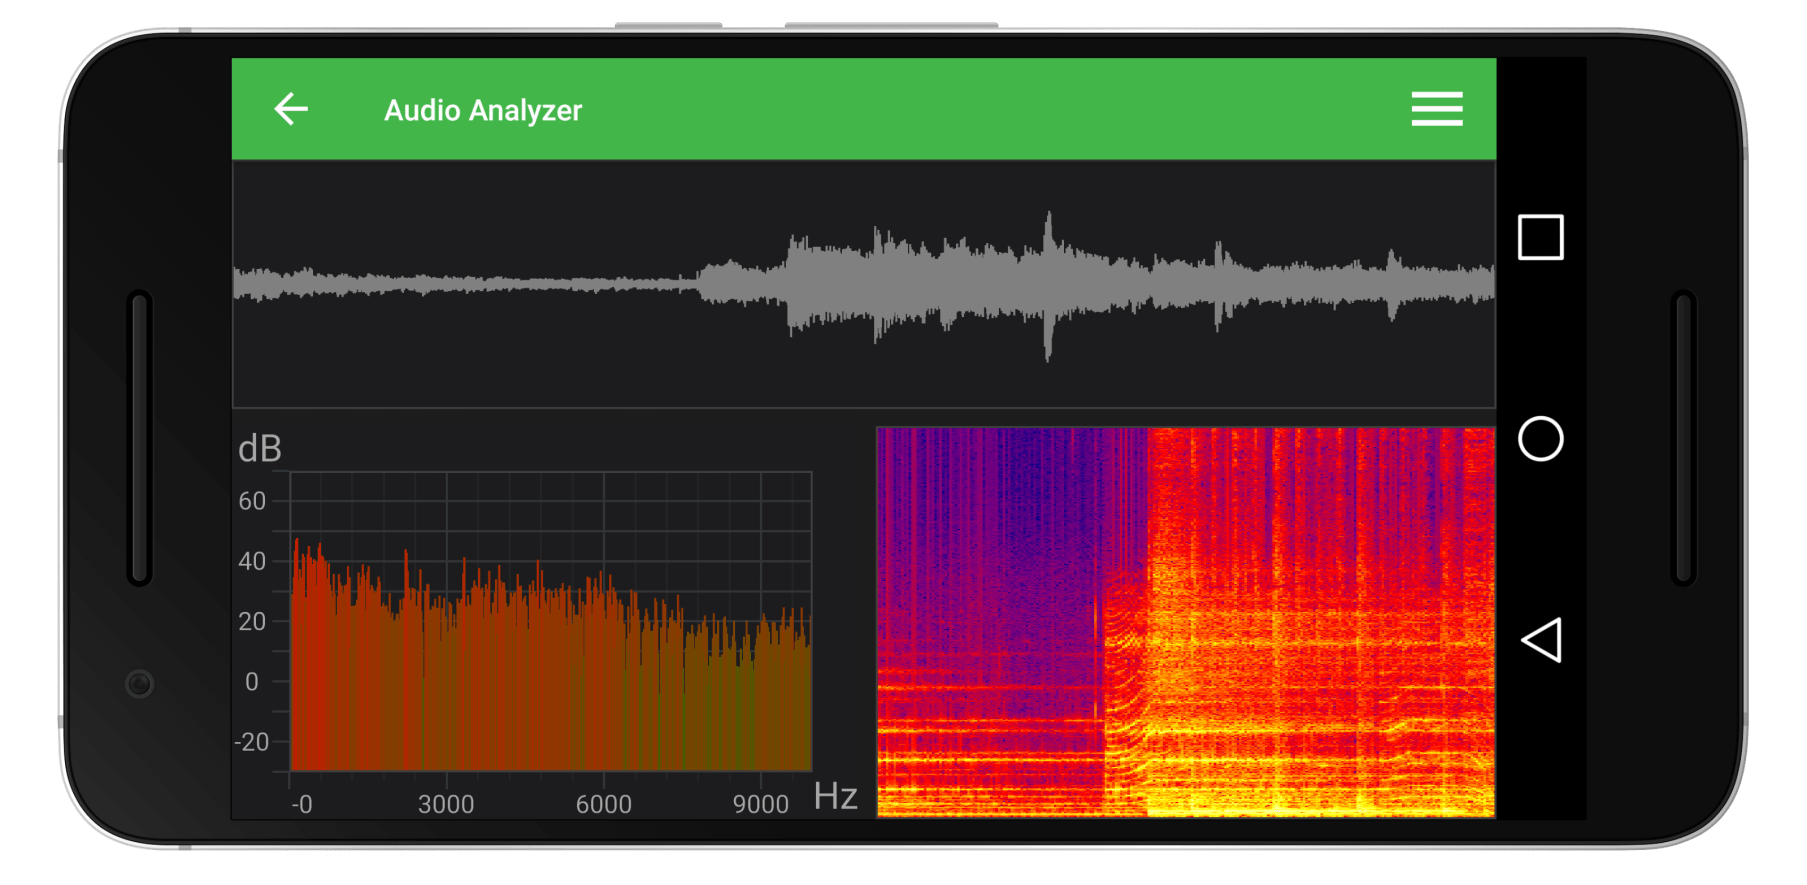
The Audio analyzer demo showcases how to use SciChart Android charts in a scientific context.
Download the examples and enable your microphone to see this demo at work.
In this example we listen to the microphone on your Android device or embedded systems and create a waveform of the sound recorded in the top chart. This chart has 500,000 data-points drawn in real-time on our High Performance charts. The example application then performs a Fourier Transform, creating a spectral / frequency analysis of the audio waveform and plots in the lower left chart. Finally, the histogram of the Fourier transform, known as a spectrogram, is plotted in a SciChart Android Heatmap control in the bottom right of the example.
If you are creating an app that needs to visualize scientific data from data-acquisition devices, audio spectra, or visualize radio frequency or spectral analysis choose SciChart to shortcut your development time & get to market faster with our well-tested, reliable Android Chart library.
The full source code for the Android Audio, Radio frequency and Spectrum Analyzer example is included below (Scroll down!).
Did you know you can also view the source code from one of the following sources as well?
<?xml version="1.0" encoding="utf-8"?>
<!--*************************************************************************-->
<!-- SCICHART® Copyright SciChart Ltd. 2011-2019. All rights reserved. -->
<!-- -->
<!-- Web: http://www.scichart.com -->
<!-- Support: support@scichart.com -->
<!-- Sales: sales@scichart.com -->
<!-- -->
<!-- example_audio_analyzer_fragment.xml is part of the SCICHART® Examples. Permission is hereby granted -->
<!-- to modify, create derivative works, distribute and publish any part of this source -->
<!-- code whether for commercial, private or personal use. -->
<!-- -->
<!-- The SCICHART® examples are distributed in the hope that they will be useful, but -->
<!-- without any warranty. It is provided "AS IS" without warranty of any kind, either -->
<!-- expressed or implied. -->
<!--*************************************************************************-->
<androidx.constraintlayout.widget.ConstraintLayout android:layout_width="match_parent"
android:layout_height="match_parent"
xmlns:android="http://schemas.android.com/apk/res/android"
xmlns:app="http://schemas.android.com/apk/res-auto"
xmlns:tools="http://schemas.android.com/tools">
<com.scichart.charting.visuals.SciChartSurface
android:id="@+id/audioStreamChart"
android:layout_width="0dp"
android:layout_height="0dp"
android:layout_marginBottom="8dp"
android:layout_weight="2"
app:layout_constraintBottom_toTopOf="@+id/horizontalGuideline"
app:layout_constraintEnd_toEndOf="parent"
app:layout_constraintHorizontal_bias="0.66"
app:layout_constraintStart_toStartOf="parent"
app:layout_constraintTop_toTopOf="parent" />
<com.scichart.charting.visuals.SciChartSurface
android:id="@+id/fftChart"
android:layout_width="0dp"
android:layout_height="0dp"
android:layout_marginEnd="4dp"
app:layout_constraintBottom_toBottomOf="parent"
app:layout_constraintEnd_toStartOf="@+id/verticalGuideline"
app:layout_constraintStart_toStartOf="parent"
app:layout_constraintTop_toTopOf="@+id/horizontalGuideline" />
<com.scichart.charting.visuals.SciChartSurface
android:id="@+id/spectrogramChart"
android:layout_width="0dp"
android:layout_height="0dp"
android:layout_marginStart="4dp"
app:layout_constraintBottom_toBottomOf="parent"
app:layout_constraintEnd_toEndOf="parent"
app:layout_constraintStart_toEndOf="@+id/verticalGuideline"
app:layout_constraintTop_toTopOf="@+id/horizontalGuideline" />
<androidx.constraintlayout.widget.Guideline
android:id="@+id/horizontalGuideline"
android:layout_width="384dp"
android:layout_height="0dp"
android:orientation="horizontal"
app:layout_constraintGuide_percent="0.40388006"
tools:layout_editor_absoluteX="0dp"
tools:layout_editor_absoluteY="229dp" />
<androidx.constraintlayout.widget.Guideline
android:id="@+id/verticalGuideline"
android:layout_width="wrap_content"
android:layout_height="wrap_content"
android:orientation="vertical"
app:layout_constraintGuide_percent="0.5026042"
tools:layout_editor_absoluteX="193dp"
tools:layout_editor_absoluteY="0dp" />
</androidx.constraintlayout.widget.ConstraintLayout>
//******************************************************************************
// SCICHART® Copyright SciChart Ltd. 2011-2020. All rights reserved.
//
// Web: http://www.scichart.com
// Support: support@scichart.com
// Sales: sales@scichart.com
//
// AudioAnalyzerShowcaseFragment.java is part of the SCICHART® Examples. Permission is hereby granted
// to modify, create derivative works, distribute and publish any part of this source
// code whether for commercial, private or personal use.
//
// The SCICHART® examples are distributed in the hope that they will be useful, but
// without any warranty. It is provided "AS IS" without warranty of any kind, either
// expressed or implied.
//******************************************************************************
package com.scichart.examples.fragments.showcase.audioAnalyzer;
import android.util.Log;
import com.scichart.charting.model.dataSeries.UniformHeatmapDataSeries;
import com.scichart.charting.model.dataSeries.XyDataSeries;
import com.scichart.charting.numerics.coordinateCalculators.ICoordinateCalculator;
import com.scichart.charting.visuals.SciChartSurface;
import com.scichart.charting.visuals.axes.AutoRange;
import com.scichart.charting.visuals.axes.AxisAlignment;
import com.scichart.charting.visuals.axes.AxisTitleOrientation;
import com.scichart.charting.visuals.axes.AxisTitlePlacement;
import com.scichart.charting.visuals.axes.NumericAxis;
import com.scichart.charting.visuals.renderableSeries.ColorMap;
import com.scichart.charting.visuals.renderableSeries.FastColumnRenderableSeries;
import com.scichart.charting.visuals.renderableSeries.FastLineRenderableSeries;
import com.scichart.charting.visuals.renderableSeries.FastUniformHeatmapRenderableSeries;
import com.scichart.charting.visuals.renderableSeries.data.ISeriesRenderPassData;
import com.scichart.charting.visuals.renderableSeries.data.XyRenderPassData;
import com.scichart.charting.visuals.renderableSeries.paletteProviders.IFillPaletteProvider;
import com.scichart.charting.visuals.renderableSeries.paletteProviders.IStrokePaletteProvider;
import com.scichart.charting.visuals.renderableSeries.paletteProviders.PaletteProviderBase;
import com.scichart.core.framework.UpdateSuspender;
import com.scichart.core.model.DoubleValues;
import com.scichart.core.model.IntegerValues;
import com.scichart.core.utility.NumberUtil;
import com.scichart.examples.R;
import com.scichart.examples.data.Radix2FFT;
import com.scichart.examples.fragments.base.ShowcaseExampleBaseFragment;
import butterknife.BindView;
import static com.scichart.drawing.utility.ColorUtil.*;
public class AudioAnalyzerShowcaseFragment extends ShowcaseExampleBaseFragment {
private static final int AUDIO_STREAM_BUFFER_SIZE = 500000;
private static final int MAX_FREQUENCY = 10000;
@Override
protected int getLayoutId() {
return R.layout.example_audio_analyzer_fragment;
}
@BindView(R.id.audioStreamChart)
SciChartSurface audioStreamChart;
@BindView(R.id.fftChart)
SciChartSurface fftChart;
@BindView(R.id.spectrogramChart)
SciChartSurface spectrogramChart;
private final IAudioAnalyzerDataProvider dataProvider = createDateProvider();
private final int bufferSize = dataProvider.getBufferSize();
private final int sampleRate = dataProvider.getSampleRate();
private final Radix2FFT fft = new Radix2FFT(bufferSize);
private final double hzPerDataPoint = (double)sampleRate / bufferSize;
private final int fftSize = (int)(MAX_FREQUENCY / hzPerDataPoint);
private final int fftCount = AUDIO_STREAM_BUFFER_SIZE / bufferSize;
private final int fftValuesCount = fftSize * fftCount;
private final int fftOffsetValueCount = fftValuesCount - fftSize;
private final DoubleValues fftData = new DoubleValues();
private final DoubleValues spectrogramValues = new DoubleValues(fftValuesCount);
private final XyDataSeries<Long, Short> audioDS = new XyDataSeries<>(Long.class, Short.class);
private final XyDataSeries<Double, Double> fftDS = new XyDataSeries<>(Double.class, Double.class);
private final UniformHeatmapDataSeries<Long, Long, Double> spectrogramDS = new UniformHeatmapDataSeries<>(Long.class, Long.class, Double.class, fftSize, fftCount);
@Override
protected void initExample() {
initAudioStreamChart();
initFFTChart();
initSpectrogramChart();
dataProvider.getData().doOnNext(audioData -> {
audioDS.append(audioData.xData, audioData.yData);
fft.run(audioData.yData, fftData);
fftData.setSize(fftSize);
fftDS.updateRangeYAt(0, fftData);
final double[] spectrogramItems = spectrogramValues.getItemsArray();
final double[] fftItems = fftData.getItemsArray();
System.arraycopy(spectrogramItems, fftSize, spectrogramItems, 0, fftOffsetValueCount);
System.arraycopy(fftItems, 0, spectrogramItems, fftOffsetValueCount, fftSize);
spectrogramDS.updateZValues(spectrogramValues);
}).compose(bindToLifecycle()).subscribe();
}
private void initAudioStreamChart() {
final NumericAxis xAxis = sciChartBuilder.newNumericAxis()
.withAutoRangeMode(AutoRange.Always)
.withDrawLabels(false)
.withDrawMinorTicks(false)
.withDrawMajorTicks(false)
.withDrawMajorBands(false)
.withDrawMinorGridLines(false)
.withDrawMajorGridLines(false)
.build();
final NumericAxis yAxis = sciChartBuilder.newNumericAxis()
.withVisibleRange(Short.MIN_VALUE, Short.MAX_VALUE)
.withDrawLabels(false)
.withDrawMinorTicks(false)
.withDrawMajorTicks(false)
.withDrawMajorBands(false)
.withDrawMinorGridLines(false)
.withDrawMajorGridLines(false)
.build();
audioDS.setFifoCapacity(AUDIO_STREAM_BUFFER_SIZE);
final FastLineRenderableSeries rs = sciChartBuilder.newLineSeries().withDataSeries(audioDS)
.withStrokeStyle(Grey, 1f)
.build();
UpdateSuspender.using(audioStreamChart, () -> {
audioStreamChart.getXAxes().add(xAxis);
audioStreamChart.getYAxes().add(yAxis);
audioStreamChart.getRenderableSeries().add(rs);
});
}
private void initFFTChart() {
final NumericAxis xAxis = sciChartBuilder.newNumericAxis()
.withDrawMajorBands(false)
.withMaxAutoTicks(5)
.withAxisTitle("Hz")
.withAxisTitlePlacement(AxisTitlePlacement.Right)
.withAxisTitleOrientation(AxisTitleOrientation.Horizontal)
.build();
final NumericAxis yAxis = sciChartBuilder.newNumericAxis()
.withAxisAlignment(AxisAlignment.Left)
.withVisibleRange(-30, 70)
.withGrowBy(0.1, 0.1)
.withDrawMinorTicks(false)
.withDrawMinorGridLines(false)
.withDrawMajorBands(false)
.withAxisTitle("dB")
.withAxisTitlePlacement(AxisTitlePlacement.Top)
.withAxisTitleOrientation(AxisTitleOrientation.Horizontal)
.build();
fftDS.setFifoCapacity(fftSize);
for (int i = 0; i < fftSize; i++) {
fftDS.append(i * hzPerDataPoint, 0d);
}
final FastColumnRenderableSeries rs = sciChartBuilder.newColumnSeries()
.withDataSeries(fftDS)
.withPaletteProvider(new FFTPaletteProvider())
.withZeroLine(-30) // set zero line equal to VisibleRange.Min
.build();
UpdateSuspender.using(fftChart, () -> {
fftChart.getXAxes().add(xAxis);
fftChart.getYAxes().add(yAxis);
fftChart.getRenderableSeries().add(rs);
});
}
private void initSpectrogramChart() {
spectrogramValues.setSize(fftValuesCount);
final NumericAxis xAxis = sciChartBuilder.newNumericAxis()
.withAutoRangeMode(AutoRange.Always)
.withDrawLabels(false)
.withDrawMinorTicks(false)
.withDrawMajorTicks(false)
.withDrawMajorBands(false)
.withDrawMinorGridLines(false)
.withDrawMajorGridLines(false)
.withAxisAlignment(AxisAlignment.Left)
.withFlipCoordinates(true)
.build();
final NumericAxis yAxis = sciChartBuilder.newNumericAxis()
.withAutoRangeMode(AutoRange.Always)
.withDrawLabels(false)
.withDrawMinorTicks(false)
.withDrawMajorTicks(false)
.withDrawMajorBands(false)
.withDrawMinorGridLines(false)
.withDrawMajorGridLines(false)
.withAxisAlignment(AxisAlignment.Bottom)
.withFlipCoordinates(true)
.build();
final FastUniformHeatmapRenderableSeries rs = sciChartBuilder.newUniformHeatmap()
.withDataSeries(spectrogramDS)
.withMinimum(-30)
.withMaximum(70)
.withColorMap(new ColorMap(
new int[]{Transparent, DarkBlue, Purple, Red, Yellow, White},
new float[]{0f, 0.0001f, 0.25f, 0.50f, 0.75f, 1f}
)).build();
UpdateSuspender.using(spectrogramChart, () -> {
spectrogramChart.getXAxes().add(xAxis);
spectrogramChart.getYAxes().add(yAxis);
spectrogramChart.getRenderableSeries().add(rs);
});
}
private static IAudioAnalyzerDataProvider createDateProvider(){
try {
return new DefaultAudioAnalyzerDataProvider();
} catch (Exception ex) {
Log.d("AudioAnalyzer", "Initialization of DefaultAudioAnalyzerDataProvider failed. Using stub implementation instead", ex);
return new StubAudioAnalyzerDataProvider();
}
}
private static class FFTPaletteProvider extends PaletteProviderBase<FastColumnRenderableSeries> implements IFillPaletteProvider, IStrokePaletteProvider {
private final IntegerValues colors = new IntegerValues();
private final int minColor = Green;
private final int maxColor = Red;
// RGB chanel values for min color
private final int minColorRed = red(minColor);
private final int minColorGreen = green(minColor);
private final int minColorBlue = blue(minColor);
// RGB chanel values for max color
private final int maxColorRed = red(maxColor);
private final int maxColorGreen = green(maxColor);
private final int maxColorBlue = blue(maxColor);
private final int diffRed = maxColorRed - minColorRed;
private final int diffGreen = maxColorGreen - minColorGreen;
private final int diffBlue = maxColorBlue - minColorBlue;
FFTPaletteProvider() {
super(FastColumnRenderableSeries.class);
}
@Override
public IntegerValues getFillColors() {
return colors;
}
@Override
public IntegerValues getStrokeColors() {
return colors;
}
@Override
public void update() {
final ISeriesRenderPassData currentRenderPassData = renderableSeries.getCurrentRenderPassData();
final XyRenderPassData xyRenderPassData = (XyRenderPassData) currentRenderPassData;
final ICoordinateCalculator yCalc = xyRenderPassData.getYCoordinateCalculator();
final double min = yCalc.getMinAsDouble();
final double max = yCalc.getMaxAsDouble();
final double diff = max - min;
final DoubleValues yValues = xyRenderPassData.yValues;
final int size = xyRenderPassData.pointsCount();
colors.setSize(size);
final double[] yItems = yValues.getItemsArray();
final int[] colorItems = colors.getItemsArray();
for (int i = 0; i < size; i++) {
final double yValue = yItems[i];
final double fraction = (yValue - min) / diff;
final int red = lerp(minColorRed, diffRed, fraction);
final int green = lerp(minColorGreen, diffGreen, fraction);
final int blue = lerp(minColorBlue, diffBlue, fraction);
colorItems[i] = rgb(red, green, blue);
}
}
private static int lerp(int minColor, int diffColor, double fraction) {
final double intepolatedValue = minColor + fraction * diffColor;
return (int) NumberUtil.constrain(intepolatedValue, 0, 255);
}
}
}
//******************************************************************************
// SCICHART® Copyright SciChart Ltd. 2011-2020. All rights reserved.
//
// Web: http://www.scichart.com
// Support: support@scichart.com
// Sales: sales@scichart.com
//
// AudioData.java is part of the SCICHART® Examples. Permission is hereby granted
// to modify, create derivative works, distribute and publish any part of this source
// code whether for commercial, private or personal use.
//
// The SCICHART® examples are distributed in the hope that they will be useful, but
// without any warranty. It is provided "AS IS" without warranty of any kind, either
// expressed or implied.
//******************************************************************************
package com.scichart.examples.fragments.showcase.audioAnalyzer;
import com.scichart.core.model.LongValues;
import com.scichart.core.model.ShortValues;
public class AudioData {
public final int pointsCount;
public final LongValues xData;
public final ShortValues yData;
public AudioData(int pointsCount) {
this.pointsCount = pointsCount;
this.xData = new LongValues(pointsCount);
this.yData = new ShortValues(pointsCount);
this.xData.setSize(pointsCount);
this.yData.setSize(pointsCount);
}
}
//******************************************************************************
// SCICHART® Copyright SciChart Ltd. 2011-2020. All rights reserved.
//
// Web: http://www.scichart.com
// Support: support@scichart.com
// Sales: sales@scichart.com
//
// DefaultAudioAnalyzerDataProvider.java is part of the SCICHART® Examples. Permission is hereby granted
// to modify, create derivative works, distribute and publish any part of this source
// code whether for commercial, private or personal use.
//
// The SCICHART® examples are distributed in the hope that they will be useful, but
// without any warranty. It is provided "AS IS" without warranty of any kind, either
// expressed or implied.
//******************************************************************************
package com.scichart.examples.fragments.showcase.audioAnalyzer;
import android.media.AudioFormat;
import android.media.AudioRecord;
import com.scichart.examples.fragments.base.DataProviderBase;
import java.util.concurrent.TimeUnit;
public class DefaultAudioAnalyzerDataProvider extends DataProviderBase<AudioData> implements IAudioAnalyzerDataProvider {
private final int sampleRate;
private final int minBufferSize; // should be with power of 2 for correct work of FFT
private final AudioRecord audioRecord;
private final AudioData audioData;
private long time = 0L;
public DefaultAudioAnalyzerDataProvider(int sampleRate, int minBufferSize) {
super(sampleRate / minBufferSize, TimeUnit.MILLISECONDS);
this.sampleRate = sampleRate;
this.minBufferSize = minBufferSize;
this.audioRecord = new AudioRecord(1, sampleRate, AudioFormat.CHANNEL_IN_MONO, AudioFormat.ENCODING_PCM_16BIT, minBufferSize);
this.audioData = new AudioData(minBufferSize);
if(this.audioRecord.getState() != AudioRecord.STATE_INITIALIZED) {
throw new UnsupportedOperationException("This devices doesn't support AudioRecord");
}
}
public DefaultAudioAnalyzerDataProvider() {
this(44100, 2048);
}
@Override
protected void onStart() {
super.onStart();
audioRecord.startRecording();
}
@Override
protected void onStop() {
audioRecord.stop();
super.onStop();
}
@Override
protected AudioData onNext() {
audioRecord.read(audioData.yData.getItemsArray(), 0, minBufferSize);
final long[] itemsArray = audioData.xData.getItemsArray();
for (int i = 0; i < minBufferSize; i++) {
itemsArray[i] = time++;
}
return audioData;
}
@Override
public int getBufferSize() {
return minBufferSize;
}
@Override
public int getSampleRate() {
return sampleRate;
}
}
//******************************************************************************
// SCICHART® Copyright SciChart Ltd. 2011-2020. All rights reserved.
//
// Web: http://www.scichart.com
// Support: support@scichart.com
// Sales: sales@scichart.com
//
// IAudioAnalyzerDataProvider.java is part of the SCICHART® Examples. Permission is hereby granted
// to modify, create derivative works, distribute and publish any part of this source
// code whether for commercial, private or personal use.
//
// The SCICHART® examples are distributed in the hope that they will be useful, but
// without any warranty. It is provided "AS IS" without warranty of any kind, either
// expressed or implied.
//******************************************************************************
package com.scichart.examples.fragments.showcase.audioAnalyzer;
import com.scichart.examples.fragments.base.IDataProvider;
public interface IAudioAnalyzerDataProvider extends IDataProvider<AudioData> {
int getBufferSize();
int getSampleRate();
}
//******************************************************************************
// SCICHART® Copyright SciChart Ltd. 2011-2020. All rights reserved.
//
// Web: http://www.scichart.com
// Support: support@scichart.com
// Sales: sales@scichart.com
//
// StubAudioAnalyzerDataProvider.java is part of the SCICHART® Examples. Permission is hereby granted
// to modify, create derivative works, distribute and publish any part of this source
// code whether for commercial, private or personal use.
//
// The SCICHART® examples are distributed in the hope that they will be useful, but
// without any warranty. It is provided "AS IS" without warranty of any kind, either
// expressed or implied.
//******************************************************************************
package com.scichart.examples.fragments.showcase.audioAnalyzer;
import com.scichart.examples.fragments.base.DataProviderBase;
import java.util.Random;
import java.util.concurrent.TimeUnit;
public class StubAudioAnalyzerDataProvider extends DataProviderBase<AudioData> implements IAudioAnalyzerDataProvider {
private final int bufferSizeInShorts = 2048;
private final AudioData audioData = new AudioData(bufferSizeInShorts);
private final IYValuesProvider provider = new AggregateYValueProvider(
new FrequencySinewaveYValueProvider(8000, 0, 0, 1, 0.0000005),
new NoisySinewaveYValueProvider(8000, 0, 0.000032, 200),
new NoisySinewaveYValueProvider(6000, 0, 0.000016, 100),
new NoisySinewaveYValueProvider(4000, 0, 0.000064, 100)
);
private long time = 0L;
public StubAudioAnalyzerDataProvider() {
super(20L, TimeUnit.MILLISECONDS);
}
@Override
protected AudioData onNext() {
final long[] xItems = audioData.xData.getItemsArray();
final short[] yItems = audioData.yData.getItemsArray();
for (int i = 0; i < bufferSizeInShorts; i++) {
xItems[i] = time++;
yItems[i] = provider.getYValueForIndex(time);
}
return audioData;
}
@Override
public int getBufferSize() {
return bufferSizeInShorts;
}
@Override
public int getSampleRate() {
return 44100;
}
private interface IYValuesProvider {
short getYValueForIndex(long index);
}
private static class NoisySinewaveYValueProvider implements IYValuesProvider {
private final Random random = new Random();
private final double amplitude;
private final double phase;
private final double noiseAmplitude;
private final double wn;
public NoisySinewaveYValueProvider(double amplitude, double phase, double frequency, double noiseAmplitude) {
this.amplitude = amplitude;
this.phase = phase;
this.noiseAmplitude = noiseAmplitude;
this.wn = 2 * Math.PI * frequency;
}
@Override
public short getYValueForIndex(long index) {
return (short)(amplitude * Math.sin(index * wn + phase) + (random.nextDouble() - .5) * noiseAmplitude);
}
}
private static class FrequencySinewaveYValueProvider implements IYValuesProvider {
private final double amplitude;
private final double phase;
private final double minFrequency;
private final double maxFrequency;
private final double step;
private double frequency;
public FrequencySinewaveYValueProvider(double amplitude, double phase, double minFrequency, double maxFrequency, double step) {
this.amplitude = amplitude;
this.phase = phase;
this.minFrequency = minFrequency;
this.maxFrequency = maxFrequency;
this.step = step;
this.frequency = minFrequency;
}
@Override
public short getYValueForIndex(long index) {
this.frequency = frequency <= maxFrequency ? frequency + step : minFrequency;
final double wn = 2 * Math.PI * frequency;
return (short) (amplitude * Math.sin(index * wn + phase));
}
}
private static class AggregateYValueProvider implements IYValuesProvider {
private final IYValuesProvider[] providers;
private AggregateYValueProvider(IYValuesProvider... providers) {
this.providers = providers;
}
@Override
public short getYValueForIndex(long index) {
double sum = 0;
for (int i = 0; i < providers.length; i++) {
sum += providers[i].getYValueForIndex(index);
}
return (short) sum;
}
}
}