SciChart® the market leader in Fast WPF Charts, WPF 3D Charts, iOS Chart, Android Chart and JavaScript Chart Components
SciChart Android ships with ~90Â Android Chart Examples which you can browse, play with, view the source-code and even export each SciChart Android Chart Example to a stand-alone Android Studio project. All of this is possible with the new and improved SciChart Android Examples Suite, which ships as part of our Android Charts SDK.
SciChart’s Android Charts are popular with traders as they are a good fit for use in real-time trading systems, even in demanding, fast moving markets.
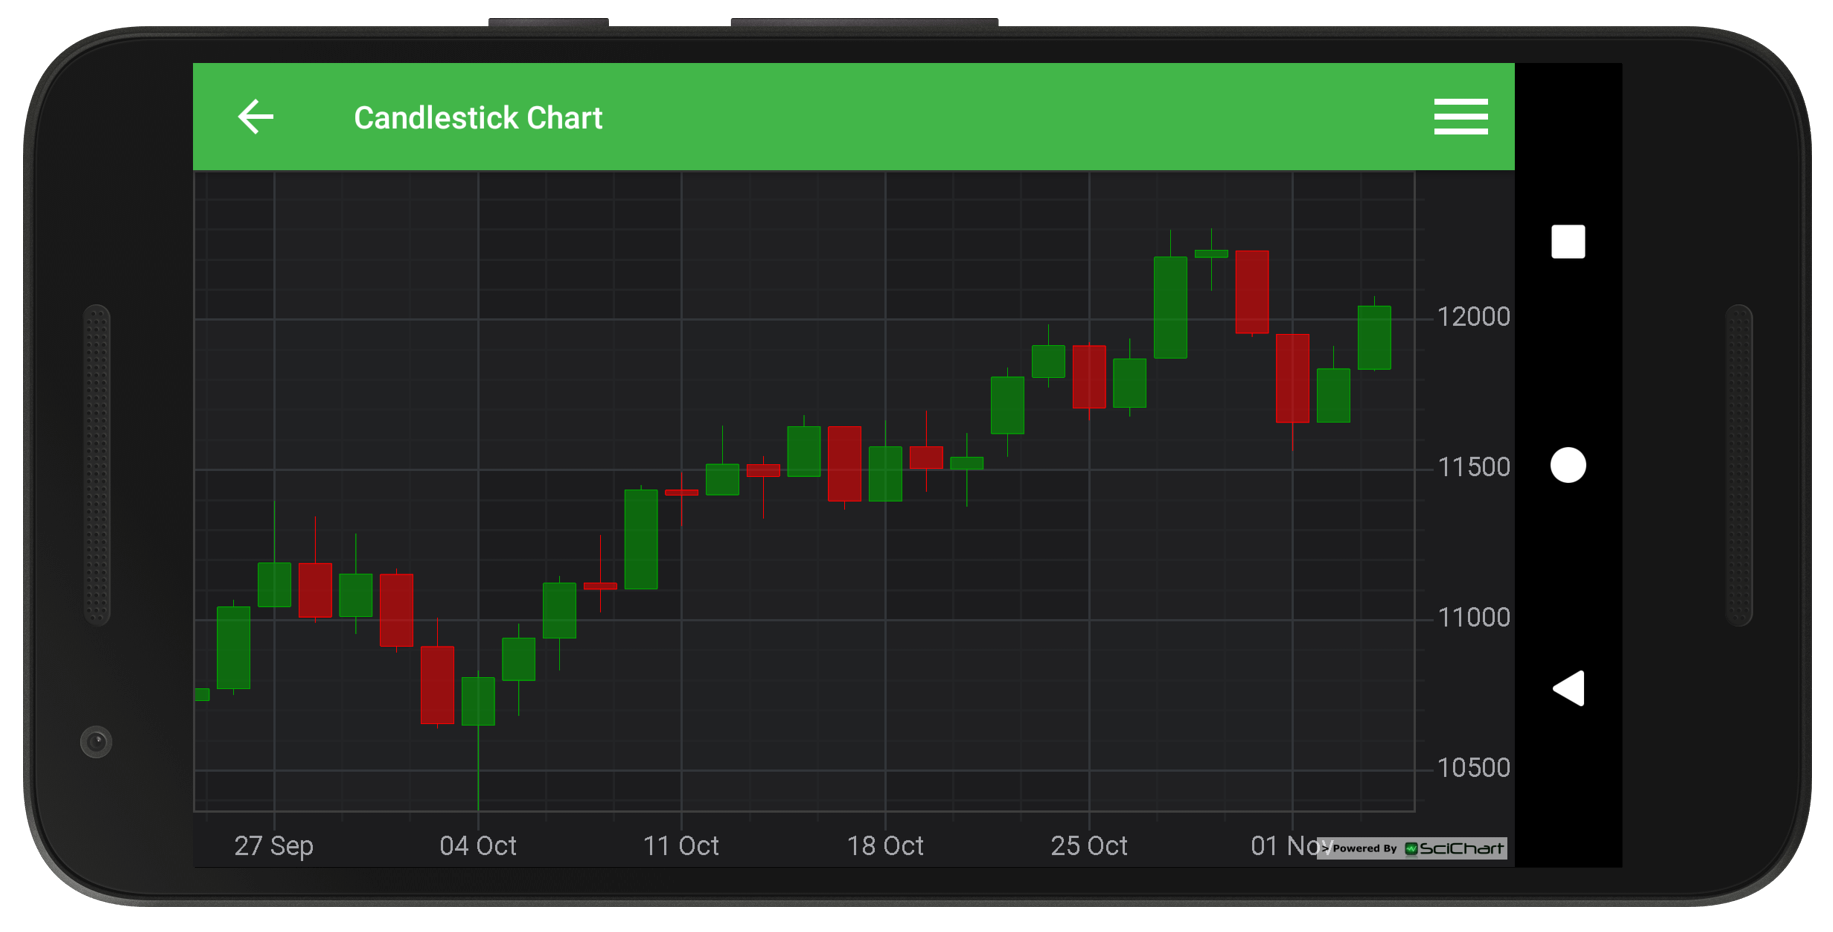
This example demonstrates how to generate a simple Android Candlestick chart in code. The FastCandlestickRenderableSeries requires an OhlcDataSeries, which contains one X-point and four Y-points (Open, High, Low, Close).
Candles are drawn using the pens set by the setStrokeUpStyle(PenStyle), setStrokeDownStyle(PenStyle) methods and the brushes set by the setFillUpBrushStyle(BrushStyle) and setFillDownBrushStyle(BrushStyle) methods, which are used depending on whether Open > Close or not.
The full source code for the Android Candlestick Chart example is included below (Scroll down!).
Did you know you can also view the source code from one of the following sources as well?
<?xml version="1.0" encoding="utf-8"?><!--*************************************************************************-->
<!-- SCICHART® Copyright SciChart Ltd. 2011-2016. All rights reserved. -->
<!-- -->
<!-- Web: http://www.scichart.com -->
<!-- Support: support@scichart.com -->
<!-- Sales: sales@scichart.com -->
<!-- -->
<!-- example_single_chart_fragment.xml is part of the SCICHART® Examples. Permission is hereby granted -->
<!-- to modify, create derivative works, distribute and publish any part of this source -->
<!-- code whether for commercial, private or personal use. -->
<!-- -->
<!-- The SCICHART® examples are distributed in the hope that they will be useful, but -->
<!-- without any warranty. It is provided "AS IS" without warranty of any kind, either -->
<!-- expressed or implied. -->
<!--*************************************************************************-->
<LinearLayout xmlns:android="http://schemas.android.com/apk/res/android"
android:layout_width="match_parent"
android:layout_height="match_parent"
android:orientation="vertical">
<com.scichart.charting.visuals.SciChartSurface
android:id="@+id/chart"
android:layout_width="fill_parent"
android:layout_height="fill_parent" />
</LinearLayout>
//******************************************************************************
// SCICHART® Copyright SciChart Ltd. 2011-2017. All rights reserved.
//
// Web: http://www.scichart.com
// Support: support@scichart.com
// Sales: sales@scichart.com
//
// CandlestickChartFragment.java is part of the SCICHART® Examples. Permission is hereby granted
// to modify, create derivative works, distribute and publish any part of this source
// code whether for commercial, private or personal use.
//
// The SCICHART® examples are distributed in the hope that they will be useful, but
// without any warranty. It is provided "AS IS" without warranty of any kind, either
// expressed or implied.
//******************************************************************************
package com.scichart.examples.fragments;
import android.view.animation.DecelerateInterpolator;
import com.scichart.charting.model.dataSeries.IOhlcDataSeries;
import com.scichart.charting.model.dataSeries.OhlcDataSeries;
import com.scichart.charting.visuals.SciChartSurface;
import com.scichart.charting.visuals.axes.AutoRange;
import com.scichart.charting.visuals.axes.IAxis;
import com.scichart.charting.visuals.renderableSeries.FastCandlestickRenderableSeries;
import com.scichart.core.framework.UpdateSuspender;
import com.scichart.examples.R;
import com.scichart.examples.data.DataManager;
import com.scichart.examples.data.PriceSeries;
import com.scichart.examples.fragments.base.ExampleBaseFragment;
import java.util.Collections;
import java.util.Date;
import butterknife.BindView;
public class CandlestickChartFragment extends ExampleBaseFragment {
@BindView(R.id.chart)
SciChartSurface surface;
@Override
protected int getLayoutId() {
return R.layout.example_single_chart_fragment;
}
@Override
protected void initExample() {
PriceSeries priceSeries = DataManager.getInstance().getPriceDataIndu(getActivity());
int size = priceSeries.size();
final IAxis xAxis = sciChartBuilder.newCategoryDateAxis().withVisibleRange(size - 30, size).withGrowBy(0, 0.1).build();
final IAxis yAxis = sciChartBuilder.newNumericAxis().withGrowBy(0d, 0.1d).withAutoRangeMode(AutoRange.Always).build();
IOhlcDataSeries<Date, Double> dataSeries = new OhlcDataSeries<>(Date.class, Double.class);
dataSeries.append(priceSeries.getDateData(), priceSeries.getOpenData(), priceSeries.getHighData(), priceSeries.getLowData(), priceSeries.getCloseData());
final FastCandlestickRenderableSeries rSeries = sciChartBuilder.newCandlestickSeries()
.withStrokeUp(0xFF00AA00)
.withFillUpColor(0x8800AA00)
.withStrokeDown(0xFFFF0000)
.withFillDownColor(0x88FF0000)
.withDataSeries(dataSeries)
.build();
UpdateSuspender.using(surface, new Runnable() {
@Override
public void run() {
Collections.addAll(surface.getXAxes(), xAxis);
Collections.addAll(surface.getYAxes(), yAxis);
Collections.addAll(surface.getRenderableSeries(), rSeries);
Collections.addAll(surface.getChartModifiers(), sciChartBuilder.newModifierGroupWithDefaultModifiers().build());
sciChartBuilder.newAnimator(rSeries).withWaveTransformation().withInterpolator(new DecelerateInterpolator()).withDuration(3000).withStartDelay(350).start();
}
});
}
}