SciChart® the market leader in Fast WPF Charts, WPF 3D Charts, iOS Chart, Android Chart and JavaScript Chart Components
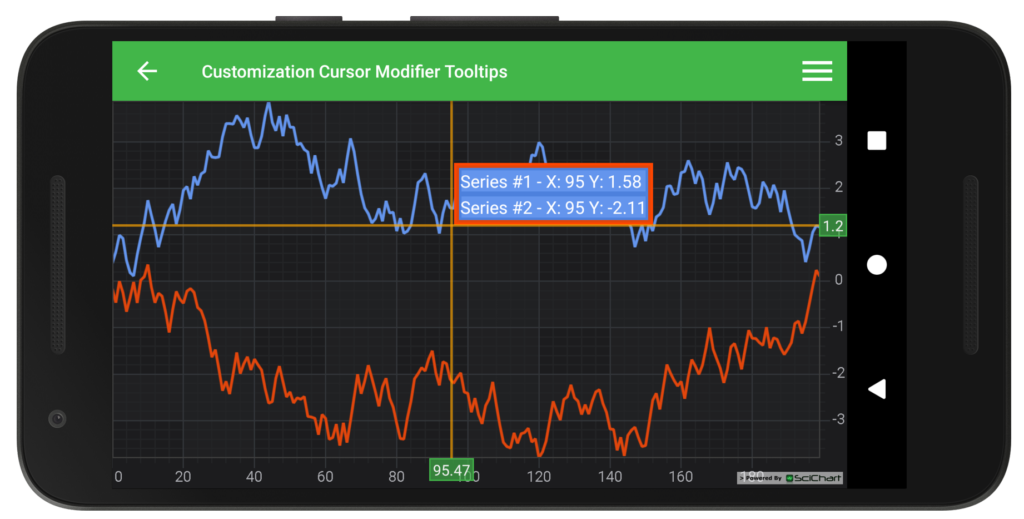
SciChart Android ships with ~90 Android Chart Examples which you can browse, play with, view the source-code and even export each SciChart Android Chart Example to a stand-alone Android Studio project. All of this is possible with the new and improved SciChart Android Examples Suite, which ships as part of our Android Charts SDK.
Demonstrates the many kinds of Stacked chart (Stacked Mountain, Stacked Column, 100% Stacked Column) available in SciChart’s Android Chart library, and allows changing of data-presentation dynamically.
To change chart type – just swipe left or right on the example.
Documentation Links:
The full source code for the Android Dashboard Style Charts example is included below (Scroll down!).
Did you know you can also view the source code from one of the following sources as well?
//******************************************************************************
// SCICHART® Copyright SciChart Ltd. 2011-2021. All rights reserved.
//
// Web: http://www.scichart.com
// Support: support@scichart.com
// Sales: sales@scichart.com
//
// DashboardStyleChartsFragment.kt is part of SCICHART®, High Performance Scientific Charts
// For full terms and conditions of the license, see http://www.scichart.com/scichart-eula/
//
// This source code is protected by international copyright law. Unauthorized
// reproduction, reverse-engineering, or distribution of all or any portion of
// this source code is strictly prohibited.
//
// This source code contains confidential and proprietary trade secrets of
// SciChart Ltd., and should at no time be copied, transferred, sold,
// distributed or made available without express written permission.
//******************************************************************************
package com.scichart.examples.fragments.examples2d.multiChart.kt
import android.content.Context
import android.view.LayoutInflater
import android.view.View
import android.view.ViewGroup
import android.widget.LinearLayout
import androidx.core.content.res.ResourcesCompat
import androidx.viewpager.widget.PagerAdapter
import com.scichart.charting.visuals.renderableSeries.HorizontallyStackedColumnsCollection
import com.scichart.charting.visuals.renderableSeries.StackedSeriesCollectionBase
import com.scichart.charting.visuals.renderableSeries.VerticallyStackedColumnsCollection
import com.scichart.charting.visuals.renderableSeries.VerticallyStackedMountainsCollection
import com.scichart.examples.R
import com.scichart.examples.databinding.ExampleDashboardStyleChartFragmentBinding
import com.scichart.examples.databinding.ExampleSingleChartFragmentBinding
import com.scichart.examples.fragments.base.ExampleBaseFragment
import com.scichart.examples.utils.scichartExtensions.*
class DashboardStyleChartsFragment : ExampleBaseFragment<ExampleDashboardStyleChartFragmentBinding>() {
override fun inflateBinding(inflater: LayoutInflater): ExampleDashboardStyleChartFragmentBinding {
return ExampleDashboardStyleChartFragmentBinding.inflate(inflater)
}
override fun initExample(binding: ExampleDashboardStyleChartFragmentBinding) {
val seriesColors = colors.map { ResourcesCompat.getColor(resources, it, null) }
val chartTypesSource = listOf(
ChartTypeModel(HorizontallyStackedColumnsCollection().apply {
for (i in 0 until 5) {
stackedColumnRenderableSeries {
xyDataSeries<Double, Double>("Series ${i + 1}") { append(xData, yData[i]) }
fillBrushStyle = LinearGradientBrushStyle(seriesColors[i * 2 + 1], seriesColors[i * 2])
strokeStyle = SolidPenStyle(seriesColors[i * 2])
}
}
}, "Stacked columns side-by-side"),
ChartTypeModel(VerticallyStackedColumnsCollection().apply {
for (i in 0 until 5) {
stackedColumnRenderableSeries {
xyDataSeries<Double, Double>("Series ${i + 1}") { append(xData, yData[i]) }
fillBrushStyle = LinearGradientBrushStyle(seriesColors[i * 2 + 1], seriesColors[i * 2])
strokeStyle = SolidPenStyle(seriesColors[i * 2])
}
}
}, "Stacked columns"),
ChartTypeModel(VerticallyStackedColumnsCollection().apply {
isOneHundredPercent = true
for (i in 0 until 5) {
stackedColumnRenderableSeries {
xyDataSeries<Double, Double>("Series ${i + 1}") { append(xData, yData[i]) }
fillBrushStyle = LinearGradientBrushStyle(seriesColors[i * 2 + 1], seriesColors[i * 2])
strokeStyle = SolidPenStyle(seriesColors[i * 2])
}
}
}, "100% Stacked columns"),
ChartTypeModel(VerticallyStackedMountainsCollection().apply {
for (i in 0 until 5) {
stackedMountainRenderableSeries {
xyDataSeries<Double, Double>("Series ${i + 1}") { append(xData, yData[i]) }
areaStyle = LinearGradientBrushStyle(seriesColors[i * 2 + 1], seriesColors[i * 2])
strokeStyle = SolidPenStyle(seriesColors[i * 2])
}
}
}, "Stacked mountains"),
ChartTypeModel(VerticallyStackedMountainsCollection().apply {
isOneHundredPercent = true
for (i in 0 until 5) {
stackedMountainRenderableSeries {
xyDataSeries<Double, Double>("Series ${i + 1}") { append(xData, yData[i]) }
areaStyle = LinearGradientBrushStyle(seriesColors[i * 2 + 1], seriesColors[i * 2])
strokeStyle = SolidPenStyle(seriesColors[i * 2])
}
}
}, "100% Stacked mountains"),
)
binding.tabLayout.setupWithViewPager(binding.viewpager.apply {
offscreenPageLimit = 5
adapter = ViewPagerAdapter(context, chartTypesSource)
})
}
internal class ViewPagerAdapter(private val context: Context, private val chartTypesSource: List<ChartTypeModel>) : PagerAdapter() {
override fun instantiateItem(collection: ViewGroup, position: Int): Any {
val inflater = LayoutInflater.from(context)
val binding: ExampleSingleChartFragmentBinding = ExampleSingleChartFragmentBinding.inflate(inflater, collection, false)
val chartTypeModel = chartTypesSource[position]
updateSurface(chartTypeModel, binding)
val root: LinearLayout = binding.root
collection.addView(root)
return root
}
private fun updateSurface(chartTypeModel: ChartTypeModel, binding: ExampleSingleChartFragmentBinding) {
binding.surface.suspendUpdates {
xAxes { numericAxis() }
yAxes { numericAxis() }
renderableSeries {
rSeries(chartTypeModel.seriesCollection)
}
}
}
override fun destroyItem(collection: ViewGroup, position: Int, view: Any) {
collection.removeView(view as View)
}
override fun getCount(): Int = chartTypesSource.size
override fun isViewFromObject(view: View, `object`: Any): Boolean = view === `object`
override fun getPageTitle(position: Int): CharSequence = chartTypesSource[position].typeName
}
internal class ChartTypeModel(val seriesCollection: StackedSeriesCollectionBase<*>, val typeName: String)
companion object {
private val xData = listOf(0.0, 1.0, 2.0, 3.0, 4.0, 5.0, 6.0, 7.0, 8.0, 9.0, 10.0, 11.0)
private val yData = arrayOf(
listOf(10.0, 13.0, 7.0, 16.0, 4.0, 6.0, 20.0, 14.0, 16.0, 10.0, 24.0, 11.0),
listOf(12.0, 17.0, 21.0, 15.0, 19.0, 18.0, 13.0, 21.0, 22.0, 20.0, 5.0, 10.0),
listOf(7.0, 30.0, 27.0, 24.0, 21.0, 15.0, 17.0, 26.0, 22.0, 28.0, 21.0, 22.0),
listOf(16.0, 10.0, 9.0, 8.0, 22.0, 14.0, 12.0, 27.0, 25.0, 23.0, 17.0, 17.0),
listOf(7.0, 24.0, 21.0, 11.0, 19.0, 17.0, 14.0, 27.0, 26.0, 22.0, 28.0, 16.0)
)
private val colors = intArrayOf(
R.color.dashboard_chart_blue_series_0, R.color.dashboard_chart_blue_series_1,
R.color.dashboard_chart_orange_series_0, R.color.dashboard_chart_orange_series_1,
R.color.dashboard_chart_red_series_0, R.color.dashboard_chart_red_series_1,
R.color.dashboard_chart_green_series_0, R.color.dashboard_chart_green_series_1,
R.color.dashboard_chart_violet_series_0, R.color.dashboard_chart_violet_series_1
)
}
}
//******************************************************************************
// SCICHART® Copyright SciChart Ltd. 2011-2021. All rights reserved.
//
// Web: http://www.scichart.com
// Support: support@scichart.com
// Sales: sales@scichart.com
//
// DashboardStyleChartsFragment.java is part of SCICHART®, High Performance Scientific Charts
// For full terms and conditions of the license, see http://www.scichart.com/scichart-eula/
//
// This source code is protected by international copyright law. Unauthorized
// reproduction, reverse-engineering, or distribution of all or any portion of
// this source code is strictly prohibited.
//
// This source code contains confidential and proprietary trade secrets of
// SciChart Ltd., and should at no time be copied, transferred, sold,
// distributed or made available without express written permission.
//******************************************************************************
package com.scichart.examples.fragments.examples2d.multiChart;
import android.content.Context;
import androidx.annotation.NonNull;
import androidx.viewpager.widget.PagerAdapter;
import androidx.viewpager.widget.ViewPager;
import android.view.LayoutInflater;
import android.view.View;
import android.view.ViewGroup;
import android.widget.LinearLayout;
import com.scichart.charting.model.dataSeries.IXyDataSeries;
import com.scichart.charting.visuals.SciChartSurface;
import com.scichart.charting.visuals.axes.IAxis;
import com.scichart.charting.visuals.renderableSeries.HorizontallyStackedColumnsCollection;
import com.scichart.charting.visuals.renderableSeries.StackedColumnRenderableSeries;
import com.scichart.charting.visuals.renderableSeries.StackedMountainRenderableSeries;
import com.scichart.charting.visuals.renderableSeries.StackedSeriesCollectionBase;
import com.scichart.charting.visuals.renderableSeries.VerticallyStackedColumnsCollection;
import com.scichart.charting.visuals.renderableSeries.VerticallyStackedMountainsCollection;
import com.scichart.core.framework.UpdateSuspender;
import com.scichart.examples.R;
import com.scichart.examples.databinding.ExampleDashboardStyleChartFragmentBinding;
import com.scichart.examples.databinding.ExampleSingleChartFragmentBinding;
import com.scichart.examples.fragments.base.ExampleBaseFragment;
import com.scichart.extensions.builders.SciChartBuilder;
import java.util.ArrayList;
import java.util.Collections;
import java.util.List;
public class DashboardStyleChartsFragment extends ExampleBaseFragment<ExampleDashboardStyleChartFragmentBinding> {
private static int[] seriesColors = new int[DashboardDataHelper.seriesColors.length];
@NonNull
@Override
protected ExampleDashboardStyleChartFragmentBinding inflateBinding(@NonNull LayoutInflater inflater) {
return ExampleDashboardStyleChartFragmentBinding.inflate(inflater);
}
@Override
protected void initExample(@NonNull ExampleDashboardStyleChartFragmentBinding binding) {
for (int i = 0; i < DashboardDataHelper.seriesColors.length; i++) {
int color = getResources().getColor(DashboardDataHelper.seriesColors[i]);
seriesColors[i] = color;
}
final List<ChartTypeModel> chartTypesSource = new ArrayList<>();
chartTypesSource.add(ChartTypeModelFactory.newHorizontallyStackedColumns(sciChartBuilder));
chartTypesSource.add(ChartTypeModelFactory.newVerticallyStackedColumns(sciChartBuilder, false));
chartTypesSource.add(ChartTypeModelFactory.newVerticallyStackedColumns(sciChartBuilder, true));
chartTypesSource.add(ChartTypeModelFactory.newVerticallyStackedMountains(sciChartBuilder, false));
chartTypesSource.add(ChartTypeModelFactory.newVerticallyStackedMountains(sciChartBuilder, true));
//this line fixes swiping lag of the viewPager by caching the pages
final ViewPager viewPager = binding.viewpager;
viewPager.setOffscreenPageLimit(5);
viewPager.setAdapter(new ViewPagerAdapter(getContext(), chartTypesSource));
binding.tabLayout.setupWithViewPager(viewPager);
}
class ViewPagerAdapter extends PagerAdapter {
private final Context context;
private final List<ChartTypeModel> chartTypesSource;
public ViewPagerAdapter(Context context, List<ChartTypeModel> chartTypesSource) {
this.context = context;
this.chartTypesSource = chartTypesSource;
}
@NonNull
@Override
public Object instantiateItem(@NonNull ViewGroup collection, int position) {
final LayoutInflater inflater = LayoutInflater.from(context);
final ExampleSingleChartFragmentBinding binding = ExampleSingleChartFragmentBinding.inflate(inflater, collection, false);
ChartTypeModel chartTypeModel = chartTypesSource.get(position);
updateSurface(chartTypeModel, binding);
final LinearLayout root = binding.getRoot();
collection.addView(root);
return root;
}
private void updateSurface(ChartTypeModel chartTypeModel, ExampleSingleChartFragmentBinding binding) {
final SciChartSurface surface = binding.surface;
UpdateSuspender.using(surface, () -> {
Collections.addAll(surface.getXAxes(), sciChartBuilder.newNumericAxis().build());
Collections.addAll(surface.getYAxes(), sciChartBuilder.newNumericAxis().build());
Collections.addAll(surface.getRenderableSeries(), chartTypeModel.getSeriesCollection());
});
}
@Override
public void destroyItem(ViewGroup collection, int position, @NonNull Object view) {
collection.removeView((View) view);
}
@Override
public int getCount() {
return chartTypesSource.size();
}
@Override
public boolean isViewFromObject(@NonNull View view, @NonNull Object object) {
return view == object;
}
@Override
public CharSequence getPageTitle(int position) {
ChartTypeModel chartTypeModel = chartTypesSource.get(position);
return chartTypeModel.getTypeName();
}
}
private static class ChartTypeModelFactory {
static ChartTypeModel newHorizontallyStackedColumns(SciChartBuilder sciChartBuilder) {
HorizontallyStackedColumnsCollection seriesCollection = new HorizontallyStackedColumnsCollection();
for (int i = 0; i < 5; i++) {
final IXyDataSeries<Double, Double> dataSeries = sciChartBuilder.newXyDataSeries(Double.class, Double.class).withSeriesName("Series " + (i + 1)).build();
dataSeries.append(DashboardDataHelper.xValues, DashboardDataHelper.yValues[i]);
StackedColumnRenderableSeries rSeries = sciChartBuilder.newStackedColumn().withDataSeries(dataSeries).withLinearGradientColors(seriesColors[i * 2 + 1], seriesColors[i * 2]).withStrokeStyle(seriesColors[i * 2]).build();
seriesCollection.add(rSeries);
}
String name = "Stacked columns side-by-side";
return new ChartTypeModel(seriesCollection, name);
}
static ChartTypeModel newVerticallyStackedColumns(SciChartBuilder sciChartBuilder, boolean isOneHundredPercent) {
VerticallyStackedColumnsCollection seriesCollection = new VerticallyStackedColumnsCollection();
seriesCollection.setIsOneHundredPercent(isOneHundredPercent);
for (int i = 0; i < 5; i++) {
final IXyDataSeries<Double, Double> dataSeries = sciChartBuilder.newXyDataSeries(Double.class, Double.class).withSeriesName("Series " + (i + 1)).build();
dataSeries.append(DashboardDataHelper.xValues, DashboardDataHelper.yValues[i]);
StackedColumnRenderableSeries rSeries = sciChartBuilder.newStackedColumn().withDataSeries(dataSeries).withLinearGradientColors(seriesColors[i * 2 + 1], seriesColors[i * 2]).withStrokeStyle(seriesColors[i * 2]).build();
seriesCollection.add(rSeries);
}
String name = isOneHundredPercent ? "100% " : "";
name += "Stacked columns";
return new ChartTypeModel(seriesCollection, name);
}
static ChartTypeModel newVerticallyStackedMountains(SciChartBuilder sciChartBuilder, boolean isOneHundredPercent) {
VerticallyStackedMountainsCollection seriesCollection = new VerticallyStackedMountainsCollection();
seriesCollection.setIsOneHundredPercent(isOneHundredPercent);
for (int i = 0; i < 5; i++) {
final IXyDataSeries<Double, Double> dataSeries = sciChartBuilder.newXyDataSeries(Double.class, Double.class).withSeriesName("Series " + (i + 1)).build();
dataSeries.append(DashboardDataHelper.xValues, DashboardDataHelper.yValues[i]);
StackedMountainRenderableSeries rSeries = sciChartBuilder.newStackedMountain().withDataSeries(dataSeries).withLinearGradientColors(seriesColors[i * 2 + 1], seriesColors[i * 2]).withStrokeStyle(seriesColors[i * 2]).build();
seriesCollection.add(rSeries);
}
String name = isOneHundredPercent ? "100% " : "";
name += "Stacked mountains";
return new ChartTypeModel(seriesCollection, name);
}
}
private static class ChartTypeModel {
private final StackedSeriesCollectionBase<?> seriesCollection;
private final String typeName;
public ChartTypeModel(StackedSeriesCollectionBase<?> seriesCollection, String header) {
this.seriesCollection = seriesCollection;
this.typeName = header;
}
public StackedSeriesCollectionBase<?> getSeriesCollection() {
return seriesCollection;
}
public String getTypeName() {
return typeName;
}
}
private static class DashboardDataHelper {
private static final Double[] xValues = {0d, 1d, 2d, 3d, 4d, 5d, 6d, 7d, 8d, 9d, 10d, 11d};
private static final Double[][] yValues = {
new Double[]{10d, 13d, 7d, 16d, 4d, 6d, 20d, 14d, 16d, 10d, 24d, 11d},
new Double[]{12d, 17d, 21d, 15d, 19d, 18d, 13d, 21d, 22d, 20d, 5d, 10d},
new Double[]{7d, 30d, 27d, 24d, 21d, 15d, 17d, 26d, 22d, 28d, 21d, 22d},
new Double[]{16d, 10d, 9d, 8d, 22d, 14d, 12d, 27d, 25d, 23d, 17d, 17d},
new Double[]{7d, 24d, 21d, 11d, 19d, 17d, 14d, 27d, 26d, 22d, 28d, 16d}
};
private static final int[] seriesColors = {
R.color.dashboard_chart_blue_series_0, R.color.dashboard_chart_blue_series_1,
R.color.dashboard_chart_orange_series_0, R.color.dashboard_chart_orange_series_1,
R.color.dashboard_chart_red_series_0, R.color.dashboard_chart_red_series_1,
R.color.dashboard_chart_green_series_0, R.color.dashboard_chart_green_series_1,
R.color.dashboard_chart_violet_series_0, R.color.dashboard_chart_violet_series_1};
}
}