SciChart® the market leader in Fast WPF Charts, WPF 3D Charts, iOS Chart, Android Chart and JavaScript Chart Components
SciChart Android ships with ~90Â Android Chart Examples which you can browse, play with, view the source-code and even export each SciChart Android Chart Example to a stand-alone Android Studio project. All of this is possible with the new and improved SciChart Android Examples Suite, which ships as part of our Android Charts SDK.
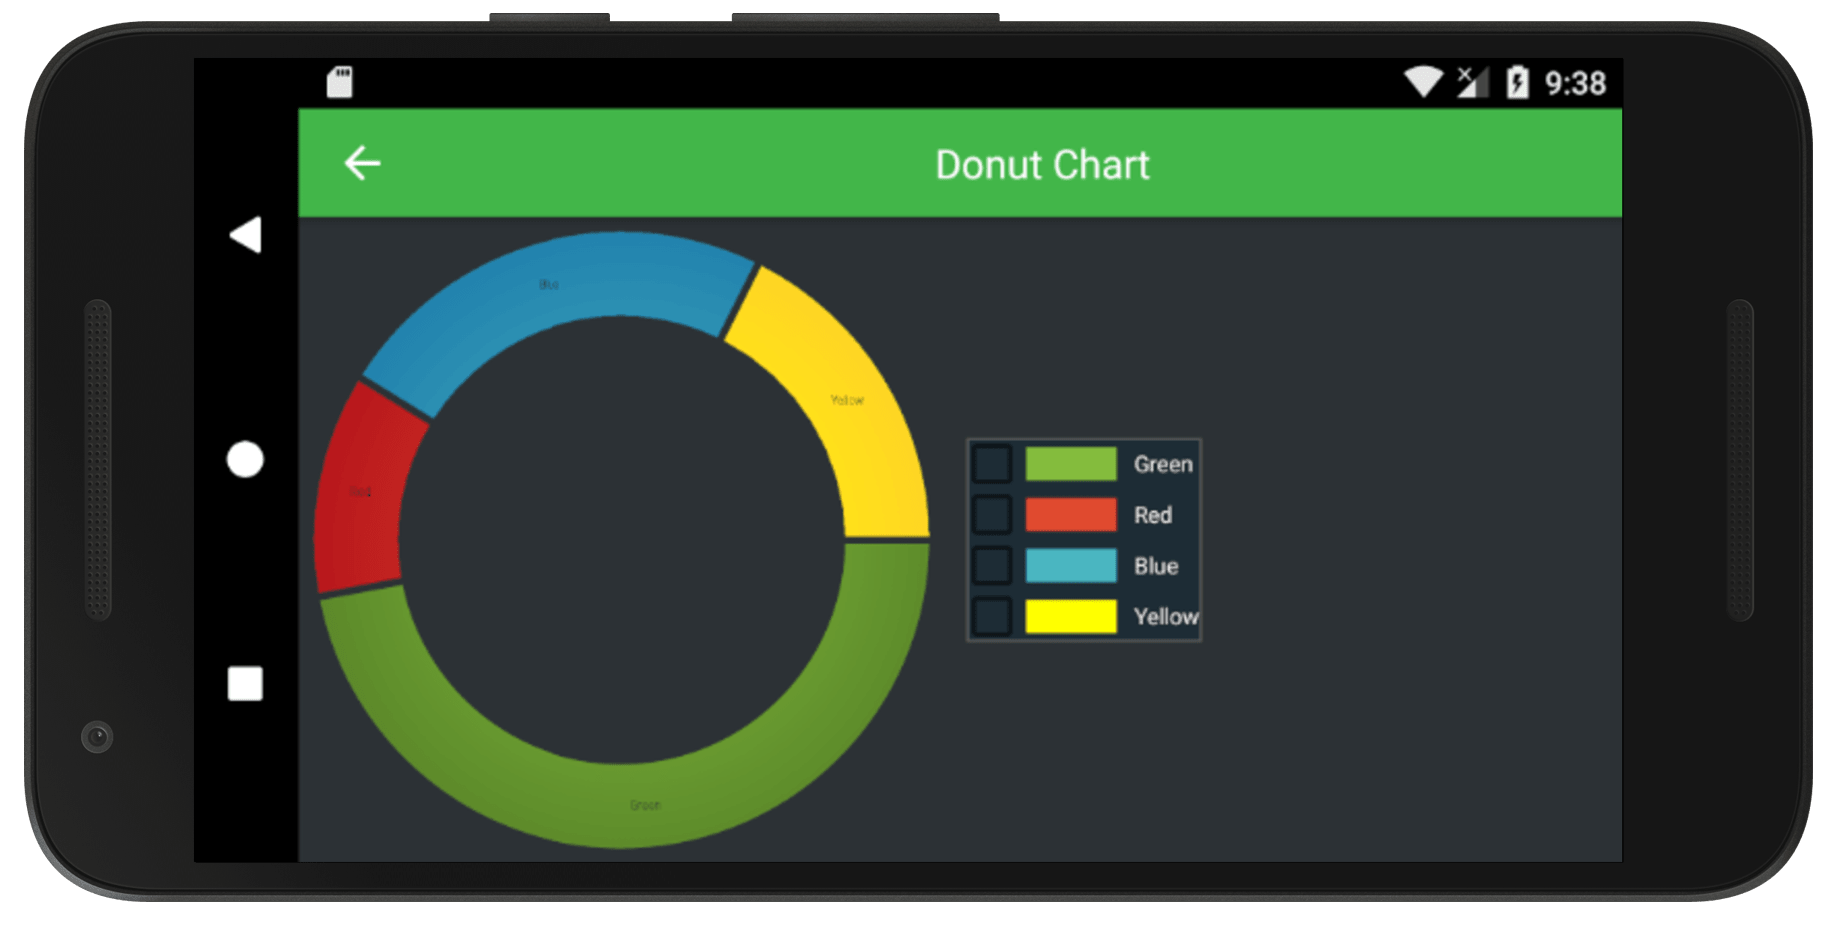
This example demonstrates how to create an Android Donut Chart in code.
See Documentation on how to use this type here:
The Android Donut Chart Documentation.
The SciPieChartSurface can be used to render either Pie, Donut or Nested Pie charts in Java.
Donut charts can be animated on show, have legends and support selection of segments, as well as showing and hiding of labels. Data is provided by a number of PieSegments, which are stored in a IPieRenderableSeries.
The full source code for the Android Donut Chart example is included below (Scroll down!).
Did you know you can also view the source code from one of the following sources as well?
//******************************************************************************
// SCICHART® Copyright SciChart Ltd. 2011-2021. All rights reserved.
//
// Web: http://www.scichart.com
// Support: support@scichart.com
// Sales: sales@scichart.com
//
// DonutChartFragment.kt is part of SCICHART®, High Performance Scientific Charts
// For full terms and conditions of the license, see http://www.scichart.com/scichart-eula/
//
// This source code is protected by international copyright law. Unauthorized
// reproduction, reverse-engineering, or distribution of all or any portion of
// this source code is strictly prohibited.
//
// This source code contains confidential and proprietary trade secrets of
// SciChart Ltd., and should at no time be copied, transferred, sold,
// distributed or made available without express written permission.
//******************************************************************************
package com.scichart.examples.fragments.examples2d.createGaugeCharts.kt
import android.view.LayoutInflater
import com.scichart.charting.visuals.renderableSeries.DonutRenderableSeries
import com.scichart.examples.databinding.ExampleSinglePieChartWithLegendFragmentBinding
import com.scichart.examples.fragments.base.ExampleBaseFragment
import com.scichart.examples.utils.scichartExtensions.*
class DonutChartFragment : ExampleBaseFragment<ExampleSinglePieChartWithLegendFragmentBinding>() {
override fun inflateBinding(inflater: LayoutInflater): ExampleSinglePieChartWithLegendFragmentBinding {
return ExampleSinglePieChartWithLegendFragmentBinding.inflate(inflater)
}
override fun initExample(binding: ExampleSinglePieChartWithLegendFragmentBinding) {
val donutSeries = DonutRenderableSeries().apply {
segmentsCollection {
pieSegment { value = 40.0; title = "Green"; fillStyle = RadialGradientBrushStyle(0xff84BC3D, 0xff5B8829) }
pieSegment { value = 10.0; title = "Red"; fillStyle = RadialGradientBrushStyle(0xffe04a2f, 0xffB7161B) }
pieSegment { value = 20.0; title = "Blue"; fillStyle = RadialGradientBrushStyle(0xff4AB6C1, 0xff2182AD) }
pieSegment { value = 15.0; title = "Yellow"; fillStyle = RadialGradientBrushStyle(0xffFFFF00, 0xfffed325) }
}
}
binding.pieChart.run {
renderableSeries { rSeries(donutSeries) }
chartModifiers {
pieChartLegendModifier(binding.pieChartLegend) { setSourceSeries(donutSeries) }
pieSegmentSelectionModifier()
}
}
donutSeries.animate(800)
}
}
//******************************************************************************
// SCICHART® Copyright SciChart Ltd. 2011-2021. All rights reserved.
//
// Web: http://www.scichart.com
// Support: support@scichart.com
// Sales: sales@scichart.com
//
// DonutChartFragment.java is part of SCICHART®, High Performance Scientific Charts
// For full terms and conditions of the license, see http://www.scichart.com/scichart-eula/
//
// This source code is protected by international copyright law. Unauthorized
// reproduction, reverse-engineering, or distribution of all or any portion of
// this source code is strictly prohibited.
//
// This source code contains confidential and proprietary trade secrets of
// SciChart Ltd., and should at no time be copied, transferred, sold,
// distributed or made available without express written permission.
//******************************************************************************
package com.scichart.examples.fragments.examples2d.createGaugeCharts;
import android.util.TypedValue;
import android.view.LayoutInflater;
import androidx.annotation.NonNull;
import com.scichart.charting.SizingMode;
import com.scichart.charting.modifiers.PieSegmentSelectionModifier;
import com.scichart.charting.visuals.SciPieChartSurface;
import com.scichart.charting.visuals.renderableSeries.IPieRenderableSeries;
import com.scichart.examples.databinding.ExampleSinglePieChartWithLegendFragmentBinding;
import com.scichart.examples.fragments.base.ExampleBaseFragment;
import java.util.Collections;
public class DonutChartFragment extends ExampleBaseFragment<ExampleSinglePieChartWithLegendFragmentBinding> {
@NonNull
@Override
protected ExampleSinglePieChartWithLegendFragmentBinding inflateBinding(@NonNull LayoutInflater inflater) {
return ExampleSinglePieChartWithLegendFragmentBinding.inflate(inflater);
}
@Override
protected void initExample(ExampleSinglePieChartWithLegendFragmentBinding binding) {
final float donutSeriesHeight = TypedValue.applyDimension(TypedValue.COMPLEX_UNIT_DIP, 50, getActivity().getResources().getDisplayMetrics());
final IPieRenderableSeries donutSeries = sciChartBuilder.newDonutSeries().withSegments(
sciChartBuilder.newPieSegment().withValue(40).withTitle("Green").withRadialGradientColors(0xff84BC3D, 0xff5B8829).build(),
sciChartBuilder.newPieSegment().withValue(10).withTitle("Red").withRadialGradientColors(0xffe04a2f, 0xffB7161B).build(),
sciChartBuilder.newPieSegment().withValue(20).withTitle("Blue").withRadialGradientColors(0xff4AB6C1, 0xff2182AD).build(),
sciChartBuilder.newPieSegment().withValue(15).withTitle("Yellow").withRadialGradientColors(0xffFFFF00, 0xfffed325).build()
).withHeightSizingMode(SizingMode.Absolute).withHeight(donutSeriesHeight).build();
final SciPieChartSurface pieChartSurface = binding.pieChart;
Collections.addAll(pieChartSurface.getRenderableSeries(), donutSeries);
Collections.addAll(pieChartSurface.getChartModifiers(), sciChartBuilder.newLegendModifier(binding.pieChartLegend).withSourceSeries(donutSeries).build(), new PieSegmentSelectionModifier());
donutSeries.animate(800);
}
}