SciChart® the market leader in Fast WPF Charts, WPF 3D Charts, iOS Chart, Android Chart and JavaScript Chart Components
SciChart Android ships with ~90Â Android Chart Examples which you can browse, play with, view the source-code and even export each SciChart Android Chart Example to a stand-alone Android Studio project. All of this is possible with the new and improved SciChart Android Examples Suite, which ships as part of our Android Charts SDK.
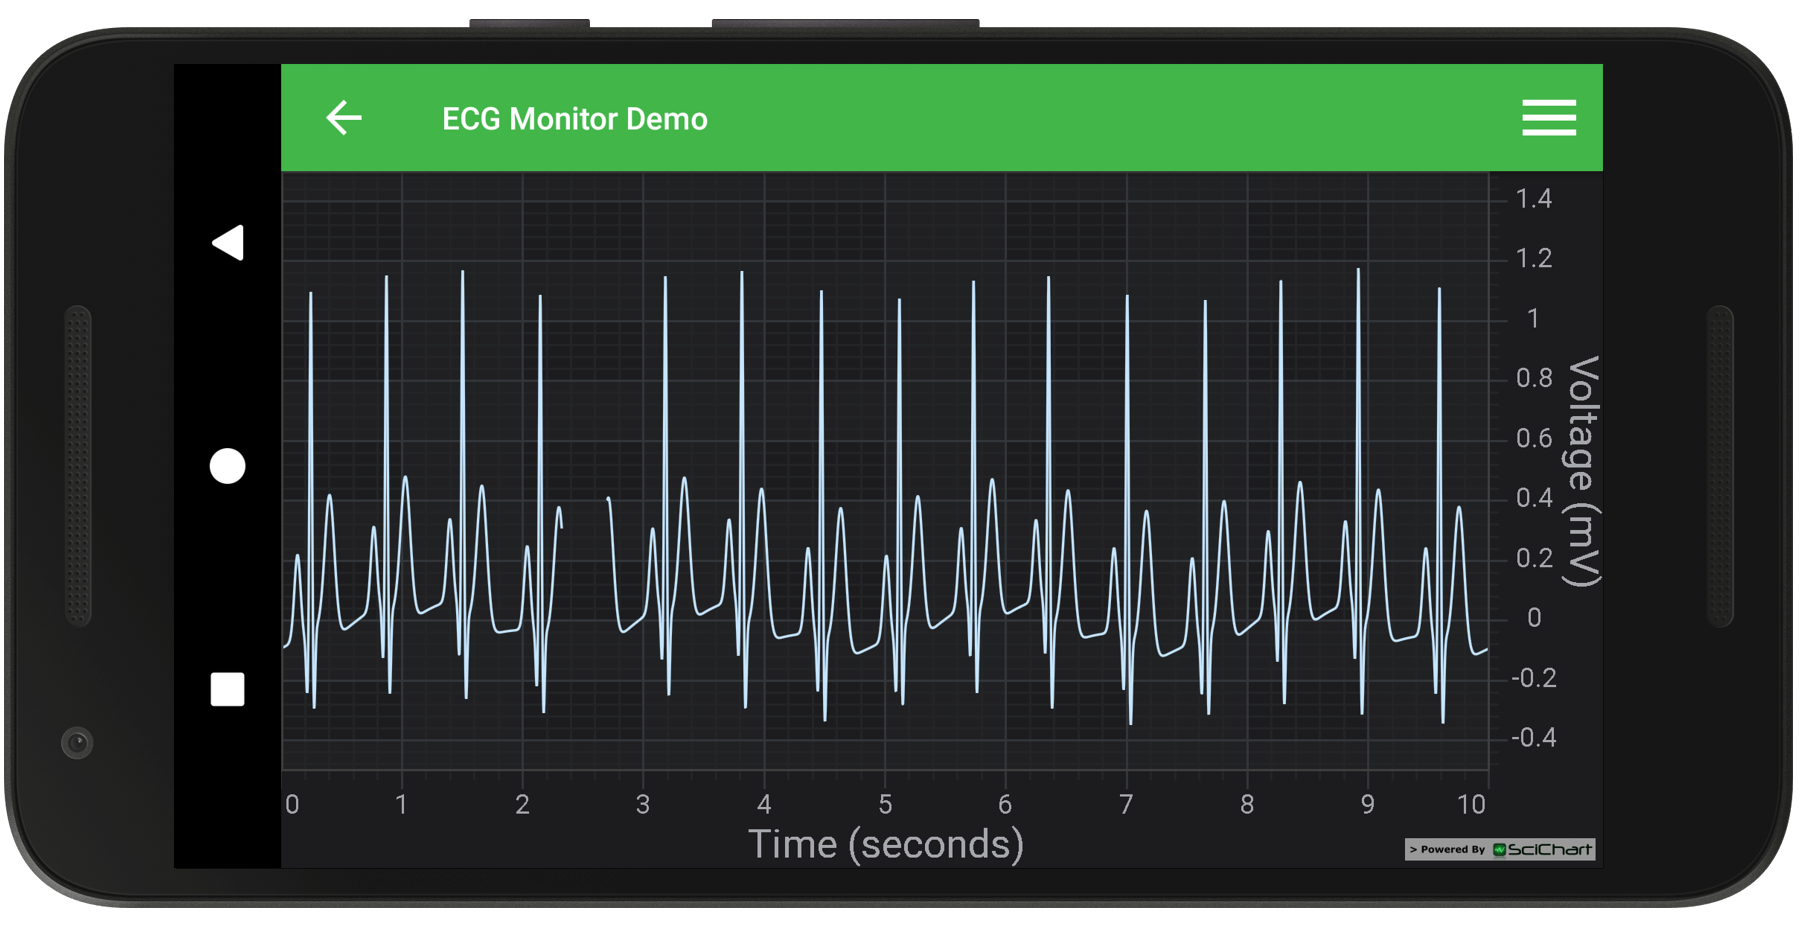
The ECG Monitor Demo showcases a real-time Android ECG/EKG heart-rate monitor app. A ECG trace is drawn from the left of the screen and when it reaches the right, it sweeps around: an effect which is common in ECG monitors. The example can run indefinitely as the FIFO chart series automatically discards points that are outside the viewport.
Tip!
Sweeping is achieved by overlaying two series, so that when the trace reaches the right edge, it wraps around again to the beginning.
The full source code for the Android ECG Monitor example is included below (Scroll down!).
Did you know you can also view the source code from one of the following sources as well?
//******************************************************************************
// SCICHART® Copyright SciChart Ltd. 2011-2021. All rights reserved.
//
// Web: http://www.scichart.com
// Support: support@scichart.com
// Sales: sales@scichart.com
//
// ECGMonitorFragment.kt is part of SCICHART®, High Performance Scientific Charts
// For full terms and conditions of the license, see http://www.scichart.com/scichart-eula/
//
// This source code is protected by international copyright law. Unauthorized
// reproduction, reverse-engineering, or distribution of all or any portion of
// this source code is strictly prohibited.
//
// This source code contains confidential and proprietary trade secrets of
// SciChart Ltd., and should at no time be copied, transferred, sold,
// distributed or made available without express written permission.
//******************************************************************************
package com.scichart.examples.fragments.featuredApps.medicalCharts.kt
import android.os.Bundle
import com.scichart.charting.visuals.SciChartSurface
import com.scichart.charting.visuals.axes.AutoRange.Never
import com.scichart.data.model.DoubleRange
import com.scichart.data.model.ISciList
import com.scichart.examples.R
import com.scichart.examples.data.DataManager
import com.scichart.examples.fragments.base.ExampleSingleChartBaseFragment
import com.scichart.examples.utils.scichartExtensions.*
import com.scichart.examples.utils.widgetgeneration.ImageViewWidget
import com.scichart.examples.utils.widgetgeneration.Widget
import java.util.*
import java.util.concurrent.Executors
import java.util.concurrent.ScheduledFuture
import java.util.concurrent.TimeUnit
class ECGMonitorFragment : ExampleSingleChartBaseFragment() {
private val series0 = XyDataSeries<Double, Double>().apply { fifoCapacity = FIFO_CAPACITY; acceptsUnsortedData = true }
private val series1 = XyDataSeries<Double, Double>().apply { fifoCapacity = FIFO_CAPACITY; acceptsUnsortedData = true }
private lateinit var sourceData: DoubleArray
private var _currentIndex = 0
private var _totalIndex = 0
private var whichTrace = TraceAOrB.TraceA
private val scheduledExecutorService = Executors.newSingleThreadScheduledExecutor()
private lateinit var schedule: ScheduledFuture<*>
@Volatile
private var isRunning = true
override fun showDefaultModifiersInToolbar(): Boolean = false
override fun getToolbarItems(): List<Widget> = ArrayList<Widget>().apply {
add(ImageViewWidget.Builder().setId(R.drawable.example_toolbar_play).setListener { isRunning = true }.build())
add(ImageViewWidget.Builder().setId(R.drawable.example_toolbar_pause).setListener { isRunning = false }.build())
}
override fun initExample(surface: SciChartSurface) {
surface.suspendUpdates {
xAxes { numericAxis {
visibleRange = DoubleRange(0.0, 10.0)
autoRange = Never
axisTitle = "Time (seconds)"
}}
yAxes { numericAxis {
visibleRange = DoubleRange(-0.5, 1.5)
axisTitle = "Voltage (mV)"
}}
renderableSeries {
fastLineRenderableSeries { dataSeries = series0 }
fastLineRenderableSeries { dataSeries = series1 }
}
}
schedule = scheduledExecutorService.scheduleWithFixedDelay(appendDataRunnable, 0, TIME_INTERVAL, TimeUnit.MILLISECONDS)
}
private val appendDataRunnable = Runnable {
if (!isRunning) return@Runnable
binding.surface.suspendUpdates {
for (i in 0 until 10) {
appendPoint()
}
}
}
@Synchronized
private fun appendPoint() {
if (_currentIndex >= sourceData.size) {
_currentIndex = 0
}
// Get the next voltage and time, and append to the chart
val voltage = sourceData[_currentIndex]
val time = _totalIndex / SAMPLE_RATE % 10
if (whichTrace == TraceAOrB.TraceA) {
series0.append(time, voltage)
series1.append(time, Double.NaN)
} else {
series0.append(time, Double.NaN)
series1.append(time, voltage)
}
_currentIndex++
_totalIndex++
if (_totalIndex % 4000 == 0) {
whichTrace = if (whichTrace == TraceAOrB.TraceA) TraceAOrB.TraceB else TraceAOrB.TraceA
}
}
override fun onCreate(savedInstanceState: Bundle?) {
super.onCreate(savedInstanceState)
sourceData = DataManager.getInstance().loadWaveformData(requireContext())
savedInstanceState?.run {
_currentIndex = getInt("currentIndex")
_totalIndex = getInt("totalIndex")
val xValues0: ISciList<Double> = getParcelable("xValues0")!!
val yValues0: ISciList<Double> = getParcelable("yValues0")!!
val xValues1: ISciList<Double> = getParcelable("xValues1")!!
val yValues1: ISciList<Double> = getParcelable("yValues1")!!
series0.append(xValues0, yValues0)
series1.append(xValues1, yValues1)
}
}
override fun onSaveInstanceState(outState: Bundle) {
super.onSaveInstanceState(outState)
isRunning = false
outState.run {
putInt("currentIndex", _currentIndex)
putInt("totalIndex", _totalIndex)
putParcelable("xValues0", series0.xValues)
putParcelable("yValues0", series0.yValues)
putParcelable("xValues1", series1.xValues)
putParcelable("yValues1", series1.yValues)
}
}
override fun onDestroyView() {
super.onDestroyView()
schedule.cancel(true)
}
companion object {
private const val TIME_INTERVAL: Long = 20
private const val FIFO_CAPACITY = 3850
private const val SAMPLE_RATE = 400.0
}
internal enum class TraceAOrB {
TraceA, TraceB
}
}
//******************************************************************************
// SCICHART® Copyright SciChart Ltd. 2011-2021. All rights reserved.
//
// Web: http://www.scichart.com
// Support: support@scichart.com
// Sales: sales@scichart.com
//
// ECGMonitorFragment.java is part of SCICHART®, High Performance Scientific Charts
// For full terms and conditions of the license, see http://www.scichart.com/scichart-eula/
//
// This source code is protected by international copyright law. Unauthorized
// reproduction, reverse-engineering, or distribution of all or any portion of
// this source code is strictly prohibited.
//
// This source code contains confidential and proprietary trade secrets of
// SciChart Ltd., and should at no time be copied, transferred, sold,
// distributed or made available without express written permission.
//******************************************************************************
package com.scichart.examples.fragments.featuredApps.medicalCharts;
import android.os.Bundle;
import androidx.annotation.NonNull;
import com.scichart.charting.model.dataSeries.IXyDataSeries;
import com.scichart.charting.visuals.SciChartSurface;
import com.scichart.charting.visuals.axes.AutoRange;
import com.scichart.charting.visuals.axes.IAxis;
import com.scichart.charting.visuals.renderableSeries.IRenderableSeries;
import com.scichart.core.framework.UpdateSuspender;
import com.scichart.data.model.DoubleRange;
import com.scichart.data.model.ISciList;
import com.scichart.examples.R;
import com.scichart.examples.data.DataManager;
import com.scichart.examples.fragments.base.ExampleSingleChartBaseFragment;
import com.scichart.examples.utils.widgetgeneration.ImageViewWidget;
import com.scichart.examples.utils.widgetgeneration.Widget;
import java.util.ArrayList;
import java.util.Collections;
import java.util.List;
import java.util.concurrent.Executors;
import java.util.concurrent.ScheduledExecutorService;
import java.util.concurrent.ScheduledFuture;
import java.util.concurrent.TimeUnit;
public class ECGMonitorFragment extends ExampleSingleChartBaseFragment {
private final static long TIME_INTERVAL = 20;
private final static int FIFO_CAPACITY = 3850;
private final static double SAMPLE_RATE = 400;
private final IXyDataSeries<Double, Double> series0 = sciChartBuilder.newXyDataSeries(Double.class, Double.class).withFifoCapacity(FIFO_CAPACITY).withAcceptsUnsortedData().build();
private final IXyDataSeries<Double, Double> series1 = sciChartBuilder.newXyDataSeries(Double.class, Double.class).withFifoCapacity(FIFO_CAPACITY).withAcceptsUnsortedData().build();
private double[] sourceData;
private int _currentIndex;
private int _totalIndex;
private TraceAOrB whichTrace = TraceAOrB.TraceA;
private final ScheduledExecutorService scheduledExecutorService = Executors.newSingleThreadScheduledExecutor();
private ScheduledFuture<?> schedule;
private volatile boolean isRunning = true;
@Override
public boolean showDefaultModifiersInToolbar() {
return false;
}
@NonNull
@Override
public List<Widget> getToolbarItems() {
return new ArrayList<Widget>() {{
add(new ImageViewWidget.Builder().setId(R.drawable.example_toolbar_play).setListener(v -> isRunning = true).build());
add(new ImageViewWidget.Builder().setId(R.drawable.example_toolbar_pause).setListener(v -> isRunning = false).build());
}};
}
@Override
protected void initExample(@NonNull SciChartSurface surface) {
UpdateSuspender.using(surface, () -> {
final IAxis xBottomAxis = sciChartBuilder.newNumericAxis()
.withVisibleRange(new DoubleRange(0d, 10d))
.withAutoRangeMode(AutoRange.Never)
.withAxisTitle("Time (seconds)")
.build();
final IAxis yRightAxis = sciChartBuilder.newNumericAxis()
.withVisibleRange(new DoubleRange(-0.5d, 1.5d))
.withAxisTitle("Voltage (mV)")
.build();
final IRenderableSeries rs1 = sciChartBuilder.newLineSeries().withDataSeries(series0).build();
final IRenderableSeries rs2 = sciChartBuilder.newLineSeries().withDataSeries(series1).build();
Collections.addAll(surface.getXAxes(), xBottomAxis);
Collections.addAll(surface.getYAxes(), yRightAxis);
Collections.addAll(surface.getRenderableSeries(), rs1, rs2);
});
schedule = scheduledExecutorService.scheduleWithFixedDelay(appendDataRunnable, 0, TIME_INTERVAL, TimeUnit.MILLISECONDS);
}
private final Runnable appendDataRunnable = new Runnable() {
@Override
public synchronized void run() {
if (!isRunning) return;
UpdateSuspender.using(binding.surface, () -> {
for (int i = 0; i < 10; i++) {
appendPoint();
}
});
}
};
private synchronized void appendPoint() {
if (_currentIndex >= sourceData.length) {
_currentIndex = 0;
}
// Get the next voltage and time, and append to the chart
double voltage = sourceData[_currentIndex];
double time = (_totalIndex / SAMPLE_RATE) % 10;
if (whichTrace == TraceAOrB.TraceA) {
series0.append(time, voltage);
series1.append(time, Double.NaN);
} else {
series0.append(time, Double.NaN);
series1.append(time, voltage);
}
_currentIndex++;
_totalIndex++;
if (_totalIndex % 4000 == 0) {
whichTrace = whichTrace == TraceAOrB.TraceA ? TraceAOrB.TraceB : TraceAOrB.TraceA;
}
}
@Override
public void onCreate(Bundle savedInstanceState) {
super.onCreate(savedInstanceState);
sourceData = DataManager.getInstance().loadWaveformData(requireContext());
if (savedInstanceState != null) {
_currentIndex = savedInstanceState.getInt("currentIndex");
_totalIndex = savedInstanceState.getInt("totalIndex");
final ISciList<Double> xValues0 = savedInstanceState.getParcelable("xValues0");
final ISciList<Double> yValues0 = savedInstanceState.getParcelable("yValues0");
final ISciList<Double> xValues1 = savedInstanceState.getParcelable("xValues1");
final ISciList<Double> yValues1 = savedInstanceState.getParcelable("yValues1");
series0.append(xValues0, yValues0);
series1.append(xValues1, yValues1);
}
}
@Override
public void onSaveInstanceState(@NonNull Bundle outState) {
super.onSaveInstanceState(outState);
isRunning = false;
outState.putInt("currentIndex", _currentIndex);
outState.putInt("totalIndex", _totalIndex);
outState.putParcelable("xValues0", series0.getXValues());
outState.putParcelable("yValues0", series0.getYValues());
outState.putParcelable("xValues1", series1.getXValues());
outState.putParcelable("yValues1", series1.getYValues());
}
@Override
public void onDestroyView() {
super.onDestroyView();
if (schedule != null) {
schedule.cancel(true);
}
}
enum TraceAOrB {
TraceA,
TraceB
}
}