SciChart® the market leader in Fast WPF Charts, WPF 3D Charts, iOS Chart, Android Chart and JavaScript Chart Components
SciChart Android ships with ~90Â Android Chart Examples which you can browse, play with, view the source-code and even export each SciChart Android Chart Example to a stand-alone Android Studio project. All of this is possible with the new and improved SciChart Android Examples Suite, which ships as part of our Android Charts SDK.
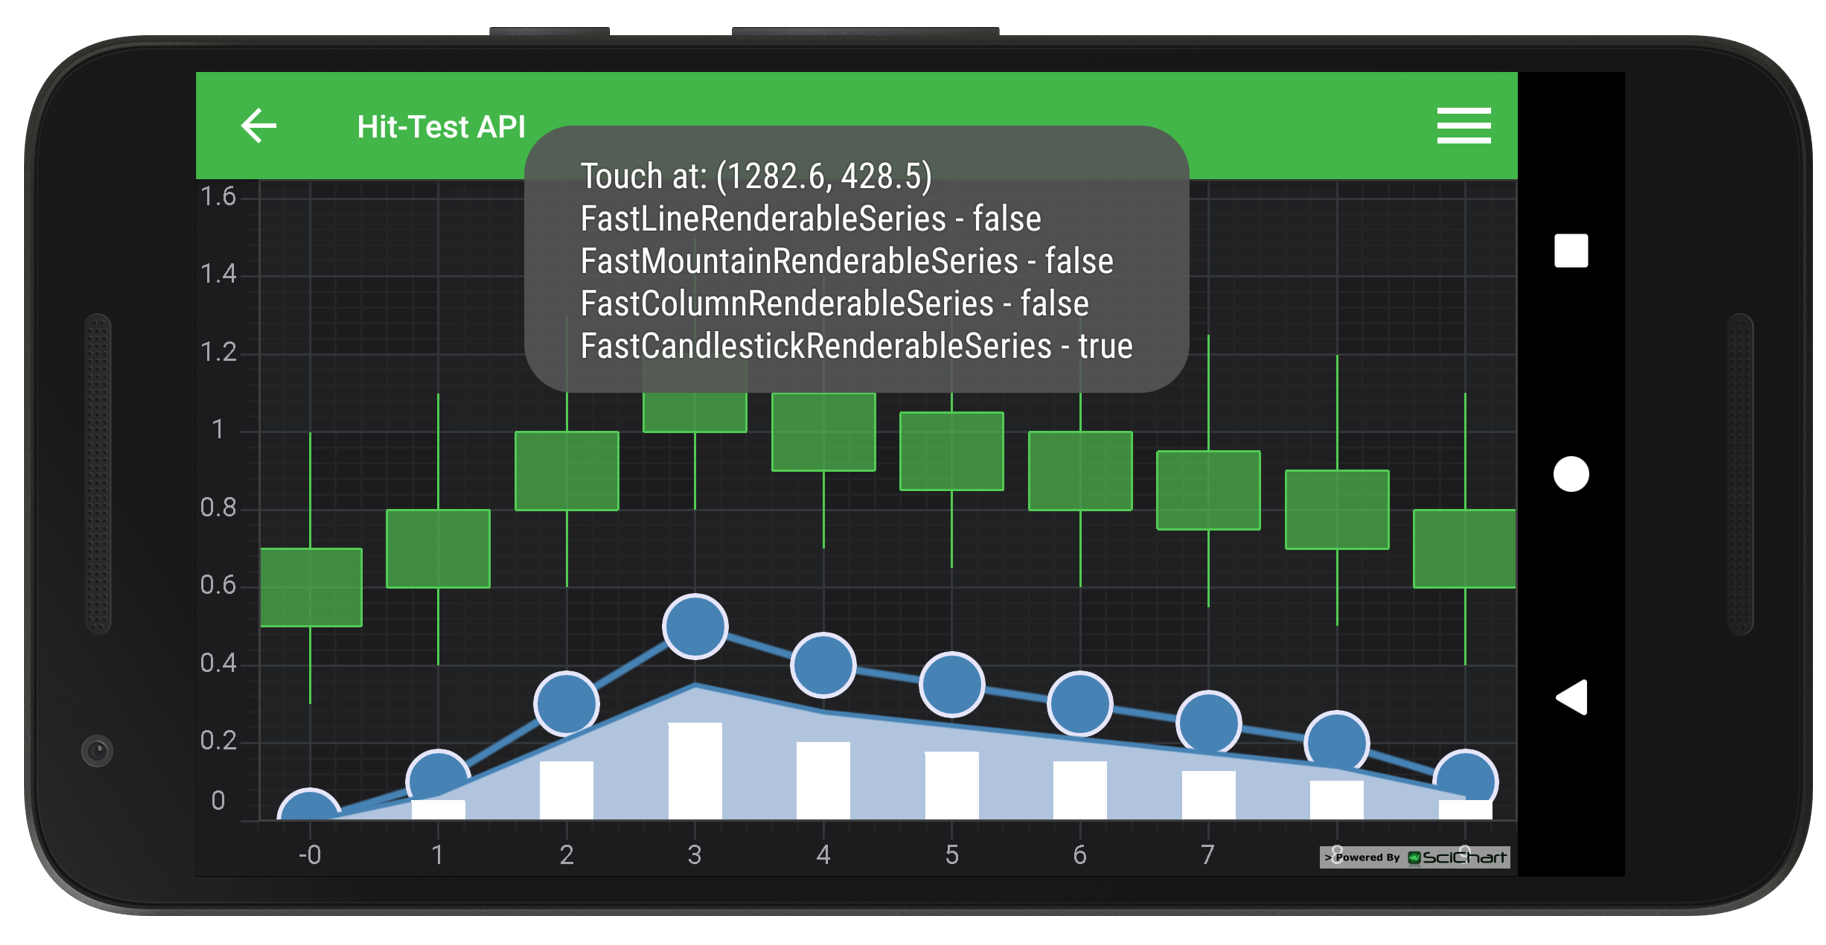
Demonstrates the Hit Test API, which can be used to get feedback about taps on data-points or lines and enable selection, or showing of context menus.
Example Usage
Tap anywhere on the chart to call BaseRenderableSeries.hitTest(). The method accepts coordinates of a touch point and returns the nearest data-point, plus its location in X,Y coordinate space.
The full source code for the Android Chart Hit-Test API example is included below (Scroll down!).
Did you know you can also view the source code from one of the following sources as well?
<?xml version="1.0" encoding="utf-8"?><!--*************************************************************************-->
<!-- SCICHART® Copyright SciChart Ltd. 2011-2016. All rights reserved. -->
<!-- -->
<!-- Web: http://www.scichart.com -->
<!-- Support: support@scichart.com -->
<!-- Sales: sales@scichart.com -->
<!-- -->
<!-- example_single_chart_fragment.xml is part of the SCICHART® Examples. Permission is hereby granted -->
<!-- to modify, create derivative works, distribute and publish any part of this source -->
<!-- code whether for commercial, private or personal use. -->
<!-- -->
<!-- The SCICHART® examples are distributed in the hope that they will be useful, but -->
<!-- without any warranty. It is provided "AS IS" without warranty of any kind, either -->
<!-- expressed or implied. -->
<!--*************************************************************************-->
<LinearLayout xmlns:android="http://schemas.android.com/apk/res/android"
android:layout_width="match_parent"
android:layout_height="match_parent"
android:orientation="vertical">
<com.scichart.charting.visuals.SciChartSurface
android:id="@+id/chart"
android:layout_width="fill_parent"
android:layout_height="fill_parent" />
</LinearLayout>
//******************************************************************************
// SCICHART® Copyright SciChart Ltd. 2011-2017. All rights reserved.
//
// Web: http://www.scichart.com
// Support: support@scichart.com
// Sales: sales@scichart.com
//
// HitTestDatapointsFragment.java is part of the SCICHART® Examples. Permission is hereby granted
// to modify, create derivative works, distribute and publish any part of this source
// code whether for commercial, private or personal use.
//
// The SCICHART® examples are distributed in the hope that they will be useful, but
// without any warranty. It is provided "AS IS" without warranty of any kind, either
// expressed or implied.
//******************************************************************************
package com.scichart.examples.fragments;
import android.graphics.PointF;
import android.view.Gravity;
import android.view.MotionEvent;
import android.view.View;
import android.view.animation.DecelerateInterpolator;
import android.widget.Toast;
import com.scichart.charting.model.dataSeries.IOhlcDataSeries;
import com.scichart.charting.model.dataSeries.IXyDataSeries;
import com.scichart.charting.model.dataSeries.OhlcDataSeries;
import com.scichart.charting.visuals.SciChartSurface;
import com.scichart.charting.visuals.axes.AxisAlignment;
import com.scichart.charting.visuals.axes.IAxis;
import com.scichart.charting.visuals.pointmarkers.EllipsePointMarker;
import com.scichart.charting.visuals.renderableSeries.FastCandlestickRenderableSeries;
import com.scichart.charting.visuals.renderableSeries.FastColumnRenderableSeries;
import com.scichart.charting.visuals.renderableSeries.FastLineRenderableSeries;
import com.scichart.charting.visuals.renderableSeries.FastMountainRenderableSeries;
import com.scichart.charting.visuals.renderableSeries.IRenderableSeries;
import com.scichart.charting.visuals.renderableSeries.hitTest.HitTestInfo;
import com.scichart.core.common.Func1;
import com.scichart.core.framework.UpdateSuspender;
import com.scichart.core.utility.ListUtil;
import com.scichart.data.model.DoubleRange;
import com.scichart.drawing.utility.ColorUtil;
import com.scichart.examples.R;
import com.scichart.examples.fragments.base.ExampleBaseFragment;
import java.util.Collections;
import butterknife.BindView;
public class HitTestDatapointsFragment extends ExampleBaseFragment implements View.OnTouchListener {
@BindView(R.id.chart)
SciChartSurface surface;
private Toast toast;
private final PointF touchPoint = new PointF();
private final HitTestInfo hitTestInfo = new HitTestInfo();
@Override
public boolean showDefaultModifiersInToolbar() {
return false;
}
@Override
protected int getLayoutId() {
return R.layout.example_single_chart_fragment;
}
@Override
protected void initExample() {
IXyDataSeries<Double, Double> dataSeries0 = sciChartBuilder.newXyDataSeries(Double.class, Double.class).withSeriesName("Line Series").build();
dataSeries0.append(new Double[]{0d, 1d, 2d, 3d, 4d, 5d, 6d, 7d, 8d, 9d}, new Double[]{0d, 0.1d, 0.3d, 0.5d, 0.4d, 0.35d, 0.3d, 0.25d, 0.2d, 0.1d, 0.05d});
IXyDataSeries<Double, Double> dataSeries1 = sciChartBuilder.newXyDataSeries(Double.class, Double.class).withSeriesName("Mountain Series").build();
dataSeries1.append(dataSeries0.getXValues(), ListUtil.select(dataSeries0.getYValues(), new Func1<Double, Double>() {
@Override
public Double func(Double arg) {
return arg * 0.7d;
}
}));
IXyDataSeries<Double, Double> dataSeries2 = sciChartBuilder.newXyDataSeries(Double.class, Double.class).withSeriesName("Column Series").build();
dataSeries2.append(dataSeries0.getXValues(), ListUtil.select(dataSeries0.getYValues(), new Func1<Double, Double>() {
@Override
public Double func(Double arg) {
return arg * 0.5d;
}
}));
IOhlcDataSeries<Double, Double> dataSeries3 = new OhlcDataSeries<>(Double.class, Double.class);
dataSeries3.setSeriesName("Candlestick Series");
dataSeries3.append(dataSeries0.getXValues(), ListUtil.select(dataSeries0.getYValues(), new Func1<Double, Double>() {
@Override
public Double func(Double arg) {
return arg + 0.5d;
}
}), ListUtil.select(dataSeries0.getYValues(), new Func1<Double, Double>() {
@Override
public Double func(Double arg) {
return arg + 1d;
}
}), ListUtil.select(dataSeries0.getYValues(), new Func1<Double, Double>() {
@Override
public Double func(Double arg) {
return arg + 0.3d;
}
}), ListUtil.select(dataSeries0.getYValues(), new Func1<Double, Double>() {
@Override
public Double func(Double arg) {
return arg + 0.7d;
}
}));
final IAxis xAxis = sciChartBuilder.newNumericAxis().withAxisAlignment(AxisAlignment.Bottom).build();
final IAxis yAxis = sciChartBuilder.newNumericAxis().withAxisAlignment(AxisAlignment.Left).withGrowBy(new DoubleRange(0d, 0.1d)).build();
final FastLineRenderableSeries lineSeries = sciChartBuilder.newLineSeries()
.withDataSeries(dataSeries0)
.withStrokeStyle(ColorUtil.SteelBlue, 3)
.withPointMarker(sciChartBuilder.newPointMarker(new EllipsePointMarker())
.withSize(30, 30)
.withFill(ColorUtil.SteelBlue)
.withStroke(ColorUtil.Lavender, 2)
.build())
.build();
final FastMountainRenderableSeries mountainSeries = sciChartBuilder.newMountainSeries()
.withStrokeStyle(ColorUtil.SteelBlue, 2f)
.withAreaFillColor(ColorUtil.LightSteelBlue)
.withDataSeries(dataSeries1)
.build();
final FastColumnRenderableSeries columnSeries = sciChartBuilder.newColumnSeries()
.withDataSeries(dataSeries2)
.build();
final FastCandlestickRenderableSeries candlestickSeries = sciChartBuilder.newCandlestickSeries()
.withDataSeries(dataSeries3)
.build();
UpdateSuspender.using(surface, new Runnable() {
@Override
public void run() {
Collections.addAll(surface.getXAxes(), xAxis);
Collections.addAll(surface.getYAxes(), yAxis);
Collections.addAll(surface.getRenderableSeries(), lineSeries, mountainSeries, columnSeries, candlestickSeries);
sciChartBuilder.newAnimator(mountainSeries).withScaleTransformation().withInterpolator(new DecelerateInterpolator()).withDuration(3000).withStartDelay(350).start();
sciChartBuilder.newAnimator(candlestickSeries).withScaleTransformation(0.3d).withInterpolator(new DecelerateInterpolator()).withDuration(3000).withStartDelay(350).start();
sciChartBuilder.newAnimator(lineSeries).withScaleTransformation().withInterpolator(new DecelerateInterpolator()).withDuration(3000).withStartDelay(350).start();
sciChartBuilder.newAnimator(columnSeries).withScaleTransformation().withInterpolator(new DecelerateInterpolator()).withDuration(3000).withStartDelay(350).start();
}
});
surface.setOnTouchListener(this);
toast = Toast.makeText(getActivity(), null, Toast.LENGTH_SHORT);
toast.setGravity(Gravity.TOP | Gravity.CENTER, 0, 0);
}
@Override
public boolean onTouch(View v, MotionEvent event) {
touchPoint.set(event.getX(), event.getY());
surface.translatePoint(touchPoint, surface.getRenderableSeriesArea());
final StringBuilder stringBuilder = new StringBuilder();
stringBuilder.append(String.format("Touch at: (%.1f, %.1f)", touchPoint.x, touchPoint.y));
for (IRenderableSeries renderableSeries : surface.getRenderableSeries()) {
renderableSeries.hitTest(hitTestInfo, touchPoint.x, touchPoint.y, 30);
stringBuilder.append(String.format("\n%s - %s", renderableSeries.getClass().getSimpleName(), Boolean.toString(hitTestInfo.isHit)));
}
toast.setText(stringBuilder.toString());
toast.show();
return true;
}
}