SciChart® the market leader in Fast WPF Charts, WPF 3D Charts, iOS Chart, Android Chart and JavaScript Chart Components
SciChart Android ships with ~90Â Android Chart Examples which you can browse, play with, view the source-code and even export each SciChart Android Chart Example to a stand-alone Android Studio project. All of this is possible with the new and improved SciChart Android Examples Suite, which ships as part of our Android Charts SDK.
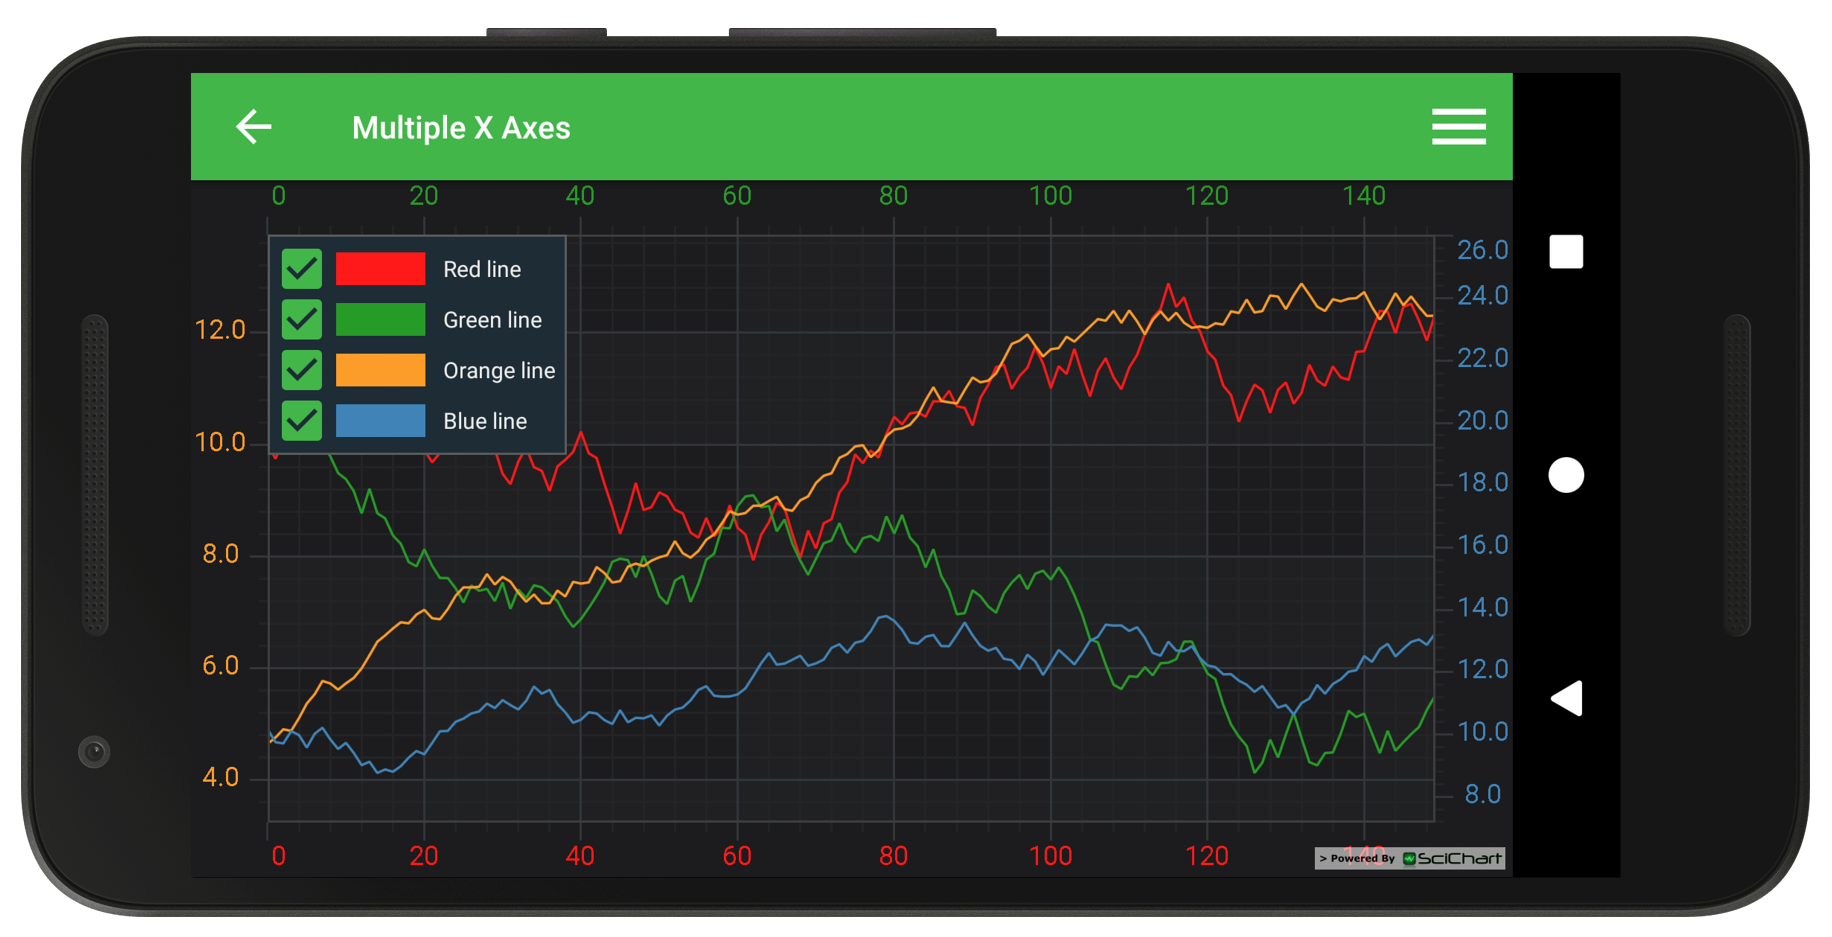
Demonstrates a line chart with four series and multiple top / bottom X-Axis and left / right Y-Axis. SciChart supports multiple top or bottom X-Axes and multiple left and right Y-Axes. This example shows in a simple way how to register a line series on each axis.
Also it is possible to have multiple Y-Axes and create Vertical Charts positioning them vertically.
Example Usage
– Drag any axis to scale.
– Drag the chart to zoom.
– Double click to reset zoom.
Tips!
To set axis placement you need to call setAxisAlignment(AxisAlignment) method with appropriate AxisAlignment value
The setAxisId(String) method can used to assign Id to and axis and attach a RenderableSeries to it.
To register RenderableSeries on axis you need to set appropriate xAxisId or yAxisId.
The full source code for the Android Multiple X-Axis Chart example is included below (Scroll down!).
Did you know you can also view the source code from one of the following sources as well?
//******************************************************************************
// SCICHART® Copyright SciChart Ltd. 2011-2021. All rights reserved.
//
// Web: http://www.scichart.com
// Support: support@scichart.com
// Sales: sales@scichart.com
//
// MultipleXAxesFragment.kt is part of SCICHART®, High Performance Scientific Charts
// For full terms and conditions of the license, see http://www.scichart.com/scichart-eula/
//
// This source code is protected by international copyright law. Unauthorized
// reproduction, reverse-engineering, or distribution of all or any portion of
// this source code is strictly prohibited.
//
// This source code contains confidential and proprietary trade secrets of
// SciChart Ltd., and should at no time be copied, transferred, sold,
// distributed or made available without express written permission.
//******************************************************************************
package com.scichart.examples.fragments.examples2d.modifyAxisBehavior.kt
import android.view.animation.DecelerateInterpolator
import com.scichart.charting.model.dataSeries.IXyDataSeries
import com.scichart.charting.modifiers.SourceMode.AllSeries
import com.scichart.charting.visuals.SciChartSurface
import com.scichart.charting.visuals.axes.AxisAlignment.*
import com.scichart.core.model.DoubleValues
import com.scichart.data.model.DoubleRange
import com.scichart.examples.fragments.base.ExampleSingleChartBaseFragment
import com.scichart.examples.utils.scichartExtensions.*
import java.util.*
class MultipleXAxesFragment: ExampleSingleChartBaseFragment() {
override fun initExample(surface: SciChartSurface) {
surface.suspendUpdates {
xAxes {
numericAxis { axisAlignment = Top; axisId = X_TOP_AXIS; setTextColor(0xFF279B27) }
numericAxis { axisAlignment = Bottom; axisId = X_BOTTOM_AXIS; setTextColor(0xFFFF1919) }
}
yAxes {
numericAxis {
axisAlignment = Left
axisId = Y_LEFT_AXIS
growBy = DoubleRange(0.1, 0.1)
textFormatting = "#.0"
setTextColor(0xFFFC9C29)
}
numericAxis {
axisAlignment = Right
axisId = Y_RIGHT_AXIS
growBy = DoubleRange(0.1, 0.1)
textFormatting = "#.0"
setTextColor(0xFF4083B7)
}
}
renderableSeries {
fastLineRenderableSeries {
xAxisId = X_BOTTOM_AXIS
yAxisId = Y_LEFT_AXIS
strokeStyle = SolidPenStyle(0xFFFF1919)
xyDataSeries<Double, Double>("Red Line") { fillDataSeries(this) }
sweepAnimation { interpolator = DecelerateInterpolator() }
}
fastLineRenderableSeries {
xAxisId = X_BOTTOM_AXIS
yAxisId = Y_LEFT_AXIS
strokeStyle = SolidPenStyle(0xFF279B27)
xyDataSeries<Double, Double>("Green Line") { fillDataSeries(this) }
sweepAnimation { interpolator = DecelerateInterpolator() }
}
fastLineRenderableSeries {
xAxisId = X_TOP_AXIS
yAxisId = Y_RIGHT_AXIS
strokeStyle = SolidPenStyle(0xFFFC9C29)
xyDataSeries<Double, Double>("Orange Line") { fillDataSeries(this) }
sweepAnimation { interpolator = DecelerateInterpolator() }
}
fastLineRenderableSeries {
xAxisId = X_TOP_AXIS
yAxisId = Y_RIGHT_AXIS
strokeStyle = SolidPenStyle(0xFF4083B7)
xyDataSeries<Double, Double>("Blue Line") { fillDataSeries(this) }
sweepAnimation { interpolator = DecelerateInterpolator() }
}
}
chartModifiers {
defaultModifiers()
legendModifier { setSourceMode(AllSeries) }
xAxisDragModifier { receiveHandledEvents = true }
yAxisDragModifier { receiveHandledEvents = true }
}
}
}
private fun fillDataSeries(dataSeries: IXyDataSeries<Double, Double>) {
val xValues = DoubleValues()
val yValues = DoubleValues()
var randomWalk = 10.0
for (i in 0 until COUNT) {
randomWalk += random.nextDouble() - 0.498
xValues.add(i.toDouble())
yValues.add(randomWalk)
}
dataSeries.append(xValues, yValues)
}
companion object {
private const val X_TOP_AXIS = "xTopAxis"
private const val X_BOTTOM_AXIS = "xBottomAxis"
private const val Y_LEFT_AXIS = "yLeftAxis"
private const val Y_RIGHT_AXIS = "yRightAxis"
private const val COUNT = 150
private val random = Random(251916)
}
}
//******************************************************************************
// SCICHART® Copyright SciChart Ltd. 2011-2021. All rights reserved.
//
// Web: http://www.scichart.com
// Support: support@scichart.com
// Sales: sales@scichart.com
//
// MultipleXAxesFragment.java is part of SCICHART®, High Performance Scientific Charts
// For full terms and conditions of the license, see http://www.scichart.com/scichart-eula/
//
// This source code is protected by international copyright law. Unauthorized
// reproduction, reverse-engineering, or distribution of all or any portion of
// this source code is strictly prohibited.
//
// This source code contains confidential and proprietary trade secrets of
// SciChart Ltd., and should at no time be copied, transferred, sold,
// distributed or made available without express written permission.
//******************************************************************************
package com.scichart.examples.fragments.examples2d.modifyAxisBehavior;
import android.view.animation.DecelerateInterpolator;
import androidx.annotation.NonNull;
import com.scichart.charting.model.dataSeries.IXyDataSeries;
import com.scichart.charting.modifiers.SourceMode;
import com.scichart.charting.visuals.SciChartSurface;
import com.scichart.charting.visuals.axes.AxisAlignment;
import com.scichart.charting.visuals.axes.IAxis;
import com.scichart.charting.visuals.renderableSeries.FastLineRenderableSeries;
import com.scichart.core.framework.UpdateSuspender;
import com.scichart.core.model.DoubleValues;
import com.scichart.data.model.DoubleRange;
import com.scichart.examples.fragments.base.ExampleSingleChartBaseFragment;
import java.util.Collections;
import java.util.Random;
public class MultipleXAxesFragment extends ExampleSingleChartBaseFragment {
private final static String X_TOP_AXIS = "xTopAxis";
private final static String X_BOTTOM_AXIS = "xBottomAxis";
private final static String Y_LEFT_AXIS = "yLeftAxis";
private final static String Y_RIGHT_AXIS = "yRightAxis";
private final static int COUNT = 150;
private final Random random = new Random(251916);
@Override
protected void initExample(@NonNull SciChartSurface surface) {
final IAxis xTopAxis = sciChartBuilder.newNumericAxis()
.withAxisAlignment(AxisAlignment.Top)
.withAxisId(X_TOP_AXIS)
.withTextColor(0xFF279B27)
.build();
final IAxis xBottomAxis = sciChartBuilder.newNumericAxis()
.withAxisAlignment(AxisAlignment.Bottom)
.withAxisId(X_BOTTOM_AXIS)
.withTextColor(0xFFFF1919)
.build();
final IAxis yLeftAxis = sciChartBuilder.newNumericAxis()
.withGrowBy(new DoubleRange(0.1d, 0.1d))
.withAxisAlignment(AxisAlignment.Left)
.withAxisId(Y_LEFT_AXIS)
.withTextFormatting("#.0")
.withTextColor(0xFFFC9C29)
.build();
final IAxis yRightAxis = sciChartBuilder.newNumericAxis()
.withGrowBy(new DoubleRange(0.1d, 0.1d))
.withAxisAlignment(AxisAlignment.Right)
.withAxisId(Y_RIGHT_AXIS)
.withTextFormatting("#.0")
.withTextColor(0xFF4083B7)
.build();
final IXyDataSeries<Double, Double> ds1 = sciChartBuilder.newXyDataSeries(Double.class, Double.class).withSeriesName("Red line").build();
final IXyDataSeries<Double, Double> ds2 = sciChartBuilder.newXyDataSeries(Double.class, Double.class).withSeriesName("Green line").build();
final IXyDataSeries<Double, Double> ds3 = sciChartBuilder.newXyDataSeries(Double.class, Double.class).withSeriesName("Orange line").build();
final IXyDataSeries<Double, Double> ds4 = sciChartBuilder.newXyDataSeries(Double.class, Double.class).withSeriesName("Blue line").build();
fillDataSeries(ds1);
fillDataSeries(ds2);
fillDataSeries(ds3);
fillDataSeries(ds4);
final FastLineRenderableSeries rs1 = sciChartBuilder.newLineSeries()
.withDataSeries(ds1)
.withXAxisId(X_BOTTOM_AXIS)
.withYAxisId(Y_LEFT_AXIS)
.withStrokeStyle(0xFFFF1919, 1f, true)
.build();
final FastLineRenderableSeries rs2 = sciChartBuilder.newLineSeries()
.withDataSeries(ds2)
.withXAxisId(X_BOTTOM_AXIS)
.withYAxisId(Y_LEFT_AXIS)
.withStrokeStyle(0xFF279B27, 1f, true)
.build();
final FastLineRenderableSeries rs3 = sciChartBuilder.newLineSeries()
.withDataSeries(ds3)
.withXAxisId(X_TOP_AXIS)
.withYAxisId(Y_RIGHT_AXIS)
.withStrokeStyle(0xFFFC9C29, 1f, true)
.build();
final FastLineRenderableSeries rs4 = sciChartBuilder.newLineSeries()
.withDataSeries(ds4)
.withXAxisId(X_TOP_AXIS)
.withYAxisId(Y_RIGHT_AXIS)
.withStrokeStyle(0xFF4083B7, 1f, true)
.build();
UpdateSuspender.using(surface, () -> {
Collections.addAll(surface.getXAxes(), xTopAxis, xBottomAxis);
Collections.addAll(surface.getYAxes(), yLeftAxis, yRightAxis);
Collections.addAll(surface.getRenderableSeries(), rs1, rs2, rs3, rs4);
Collections.addAll(surface.getChartModifiers(), sciChartBuilder.newModifierGroupWithDefaultModifiers()
.withLegendModifier().withSourceMode(SourceMode.AllSeries).build()
.withXAxisDragModifier().withReceiveHandledEvents(true).build()
.withYAxisDragModifier().withReceiveHandledEvents(true).build()
.build());
sciChartBuilder.newAnimator(rs1).withSweepTransformation().withInterpolator(new DecelerateInterpolator()).withDuration(3000).withStartDelay(350).start();
sciChartBuilder.newAnimator(rs2).withSweepTransformation().withInterpolator(new DecelerateInterpolator()).withDuration(3000).withStartDelay(350).start();
sciChartBuilder.newAnimator(rs3).withSweepTransformation().withInterpolator(new DecelerateInterpolator()).withDuration(3000).withStartDelay(350).start();
sciChartBuilder.newAnimator(rs4).withSweepTransformation().withInterpolator(new DecelerateInterpolator()).withDuration(3000).withStartDelay(350).start();
});
}
private void fillDataSeries(IXyDataSeries<Double, Double> dataSeries) {
final DoubleValues xValues = new DoubleValues();
final DoubleValues yValues = new DoubleValues();
double randomWalk = 10;
for (int i = 0; i < COUNT; i++) {
randomWalk += random.nextDouble() - 0.498;
xValues.add(i);
yValues.add(randomWalk);
}
dataSeries.append(xValues, yValues);
}
}