SciChart® the market leader in Fast WPF Charts, WPF 3D Charts, iOS Chart, Android Chart and JavaScript Chart Components
SciChart Android ships with ~90Â Android Chart Examples which you can browse, play with, view the source-code and even export each SciChart Android Chart Example to a stand-alone Android Studio project. All of this is possible with the new and improved SciChart Android Examples Suite, which ships as part of our Android Charts SDK.
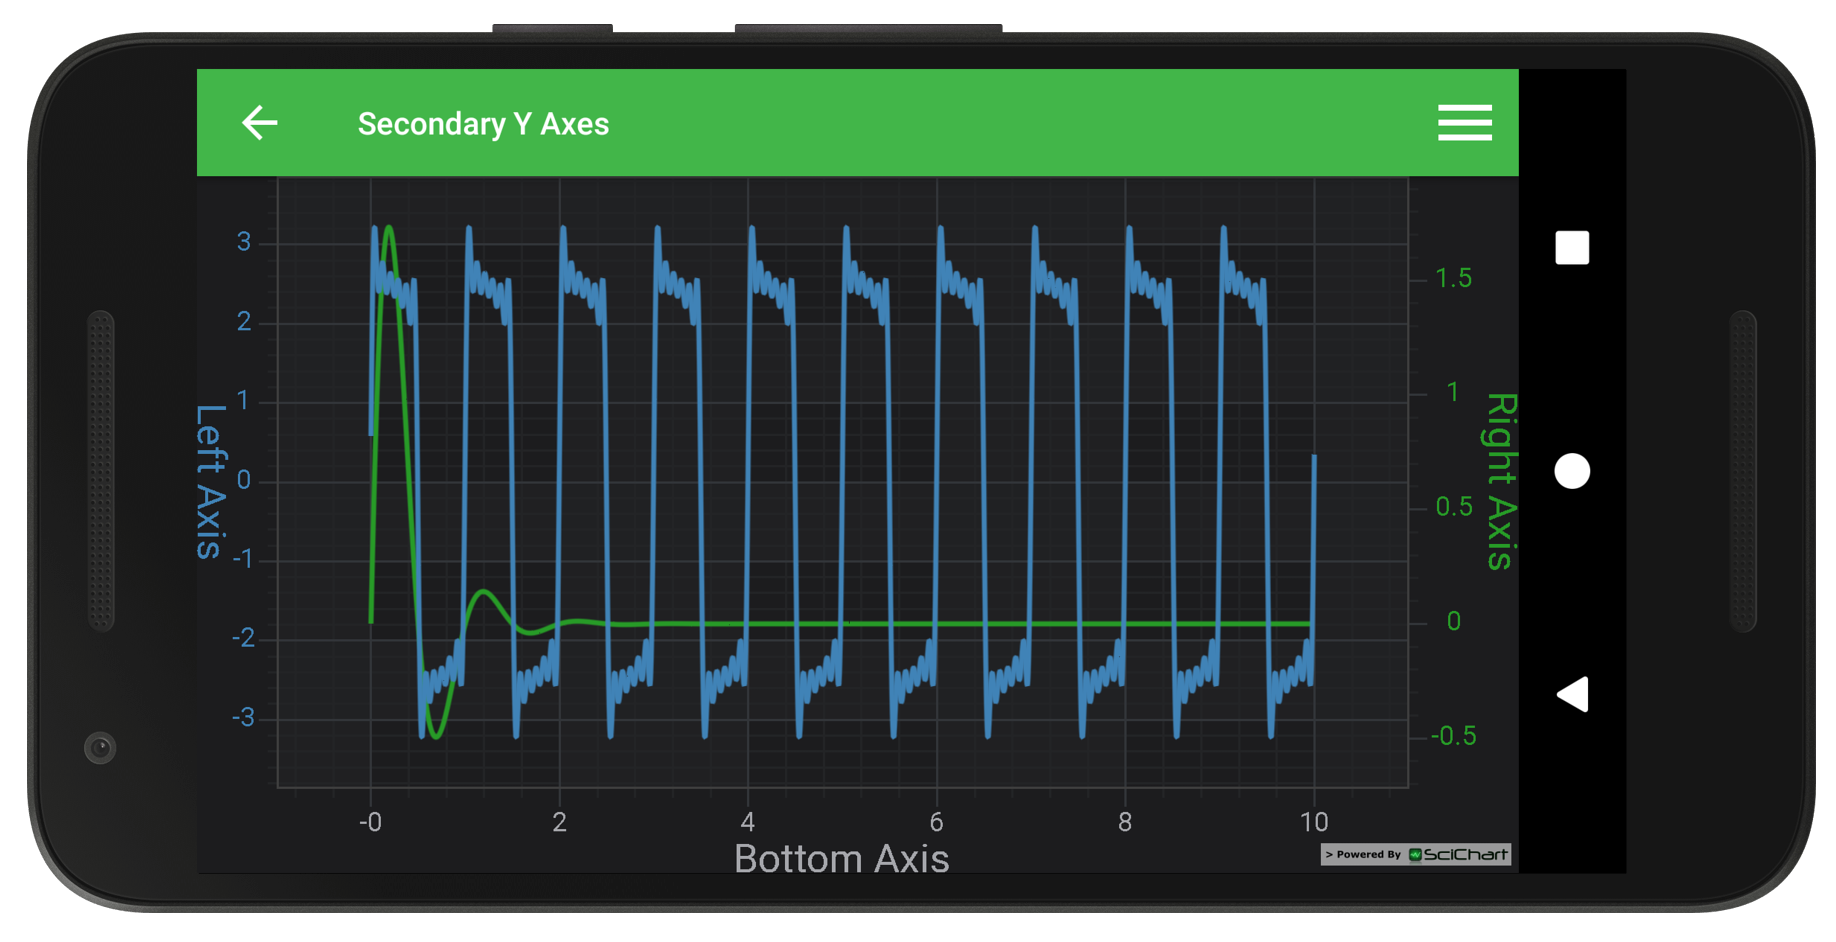
A static example which demonstrates a line chart with two series and primary and secondary Y-Axis. SciChart supports unlimited left and right Y-Axes and this example shows in a simple way how to register a line series on each axis.
Tips!
To set axis placement you need to call setAxisAlignment(AxisAlignment) method with appropriate AxisAlignment value
The setAxisId(String) method can used to assign Id to and axis and attach a RenderableSeries to it.
To register RenderableSeries on axis you need to set appropriate xAxisId or yAxisId.
The full source code for the Android Chart Secondary Y-Axis example is included below (Scroll down!).
Did you know you can also view the source code from one of the following sources as well?
<?xml version="1.0" encoding="utf-8"?><!--*************************************************************************-->
<!-- SCICHART® Copyright SciChart Ltd. 2011-2016. All rights reserved. -->
<!-- -->
<!-- Web: http://www.scichart.com -->
<!-- Support: support@scichart.com -->
<!-- Sales: sales@scichart.com -->
<!-- -->
<!-- example_single_chart_fragment.xml is part of the SCICHART® Examples. Permission is hereby granted -->
<!-- to modify, create derivative works, distribute and publish any part of this source -->
<!-- code whether for commercial, private or personal use. -->
<!-- -->
<!-- The SCICHART® examples are distributed in the hope that they will be useful, but -->
<!-- without any warranty. It is provided "AS IS" without warranty of any kind, either -->
<!-- expressed or implied. -->
<!--*************************************************************************-->
<LinearLayout xmlns:android="http://schemas.android.com/apk/res/android"
android:layout_width="match_parent"
android:layout_height="match_parent"
android:orientation="vertical">
<com.scichart.charting.visuals.SciChartSurface
android:id="@+id/chart"
android:layout_width="fill_parent"
android:layout_height="fill_parent" />
</LinearLayout>
//******************************************************************************
// SCICHART® Copyright SciChart Ltd. 2011-2017. All rights reserved.
//
// Web: http://www.scichart.com
// Support: support@scichart.com
// Sales: sales@scichart.com
//
// SecondaryYAxesFragment.java is part of the SCICHART® Examples. Permission is hereby granted
// to modify, create derivative works, distribute and publish any part of this source
// code whether for commercial, private or personal use.
//
// The SCICHART® examples are distributed in the hope that they will be useful, but
// without any warranty. It is provided "AS IS" without warranty of any kind, either
// expressed or implied.
//******************************************************************************
package com.scichart.examples.fragments;
import android.view.animation.DecelerateInterpolator;
import com.scichart.charting.model.dataSeries.IXyDataSeries;
import com.scichart.charting.visuals.SciChartSurface;
import com.scichart.charting.visuals.axes.AxisAlignment;
import com.scichart.charting.visuals.axes.IAxis;
import com.scichart.charting.visuals.renderableSeries.FastLineRenderableSeries;
import com.scichart.core.framework.UpdateSuspender;
import com.scichart.drawing.utility.ColorUtil;
import com.scichart.examples.R;
import com.scichart.examples.data.DataManager;
import com.scichart.examples.data.DoubleSeries;
import com.scichart.examples.fragments.base.ExampleBaseFragment;
import java.util.Collections;
import butterknife.BindView;
public class SecondaryYAxesFragment extends ExampleBaseFragment {
private final static String X_BOTTOM_AXIS = "xBottomAxis";
private final static String Y_LEFT_AXIS = "yLeftAxis";
private final static String Y_RIGHT_AXIS = "yRightAxis";
private final IXyDataSeries<Double, Double> ds1 = sciChartBuilder.newXyDataSeries(Double.class, Double.class).build();
private final IXyDataSeries<Double, Double> ds2 = sciChartBuilder.newXyDataSeries(Double.class, Double.class).build();
@BindView(R.id.chart)
SciChartSurface surface;
@Override
public boolean showDefaultModifiersInToolbar() {
return false;
}
@Override
protected int getLayoutId() {
return R.layout.example_single_chart_fragment;
}
@Override
protected void initExample() {
final IAxis xBottomAxis = sciChartBuilder.newNumericAxis()
.withGrowBy(0.1d, 0.1d)
.withAxisAlignment(AxisAlignment.Bottom)
.withAxisId(X_BOTTOM_AXIS)
.withAxisTitle("Bottom Axis")
.build();
final IAxis yLeftAxis = sciChartBuilder.newNumericAxis()
.withGrowBy(0.1d, 0.1d)
.withAxisAlignment(AxisAlignment.Left)
.withAxisId(Y_LEFT_AXIS)
.withAxisTitle("Left Axis")
.withTextColor(ColorUtil.argb(0xFF, 0x40, 0x83, 0xB7))
.build();
final IAxis yRightAxis = sciChartBuilder.newNumericAxis()
.withGrowBy(0.1d, 0.1d)
.withAxisAlignment(AxisAlignment.Right)
.withAxisId(Y_RIGHT_AXIS)
.withAxisTitle("Right Axis")
.withTextColor(ColorUtil.argb(0xFF, 0x27, 0x9B, 0x27))
.build();
final DoubleSeries ds1Points = DataManager.getInstance().getFourierSeries(1.0, 0.1, 5000);
final DoubleSeries ds2Points = DataManager.getInstance().getDampedSinewave(3.0, 0.005, 5000, 10);
ds1.append(ds1Points.xValues, ds1Points.yValues);
ds2.append(ds2Points.xValues, ds2Points.yValues);
final FastLineRenderableSeries rs1 = sciChartBuilder.newLineSeries()
.withDataSeries(ds2)
.withXAxisId(xBottomAxis.getAxisId())
.withYAxisId(yRightAxis.getAxisId())
.withStrokeStyle(ColorUtil.argb(0xFF, 0x27, 0x9B, 0x27), 1f, true)
.build();
final FastLineRenderableSeries rs2 = sciChartBuilder.newLineSeries()
.withDataSeries(ds1)
.withXAxisId(xBottomAxis.getAxisId())
.withYAxisId(yLeftAxis.getAxisId())
.withStrokeStyle(ColorUtil.argb(0xFF, 0x40, 0x83, 0xB7), 1f, true)
.build();
UpdateSuspender.using(surface, new Runnable() {
@Override
public void run() {
Collections.addAll(surface.getXAxes(), xBottomAxis);
Collections.addAll(surface.getYAxes(), yLeftAxis, yRightAxis);
Collections.addAll(surface.getRenderableSeries(), rs1, rs2);
Collections.addAll(surface.getChartModifiers(), sciChartBuilder.newModifierGroupWithDefaultModifiers().build());
sciChartBuilder.newAnimator(rs1).withSweepTransformation().withInterpolator(new DecelerateInterpolator()).withDuration(3000).withStartDelay(350).start();
sciChartBuilder.newAnimator(rs2).withSweepTransformation().withInterpolator(new DecelerateInterpolator()).withDuration(3000).withStartDelay(350).start();
}
});
}
}