SciChart® the market leader in Fast WPF Charts, WPF 3D Charts, iOS Chart, Android Chart and JavaScript Chart Components
SciChart Android ships with ~90 Android Chart Examples which you can browse, play with, view the source-code and even export each SciChart Android Chart Example to a stand-alone Android Studio project. All of this is possible with the new and improved SciChart Android Examples Suite, which ships as part of our Android Charts SDK.
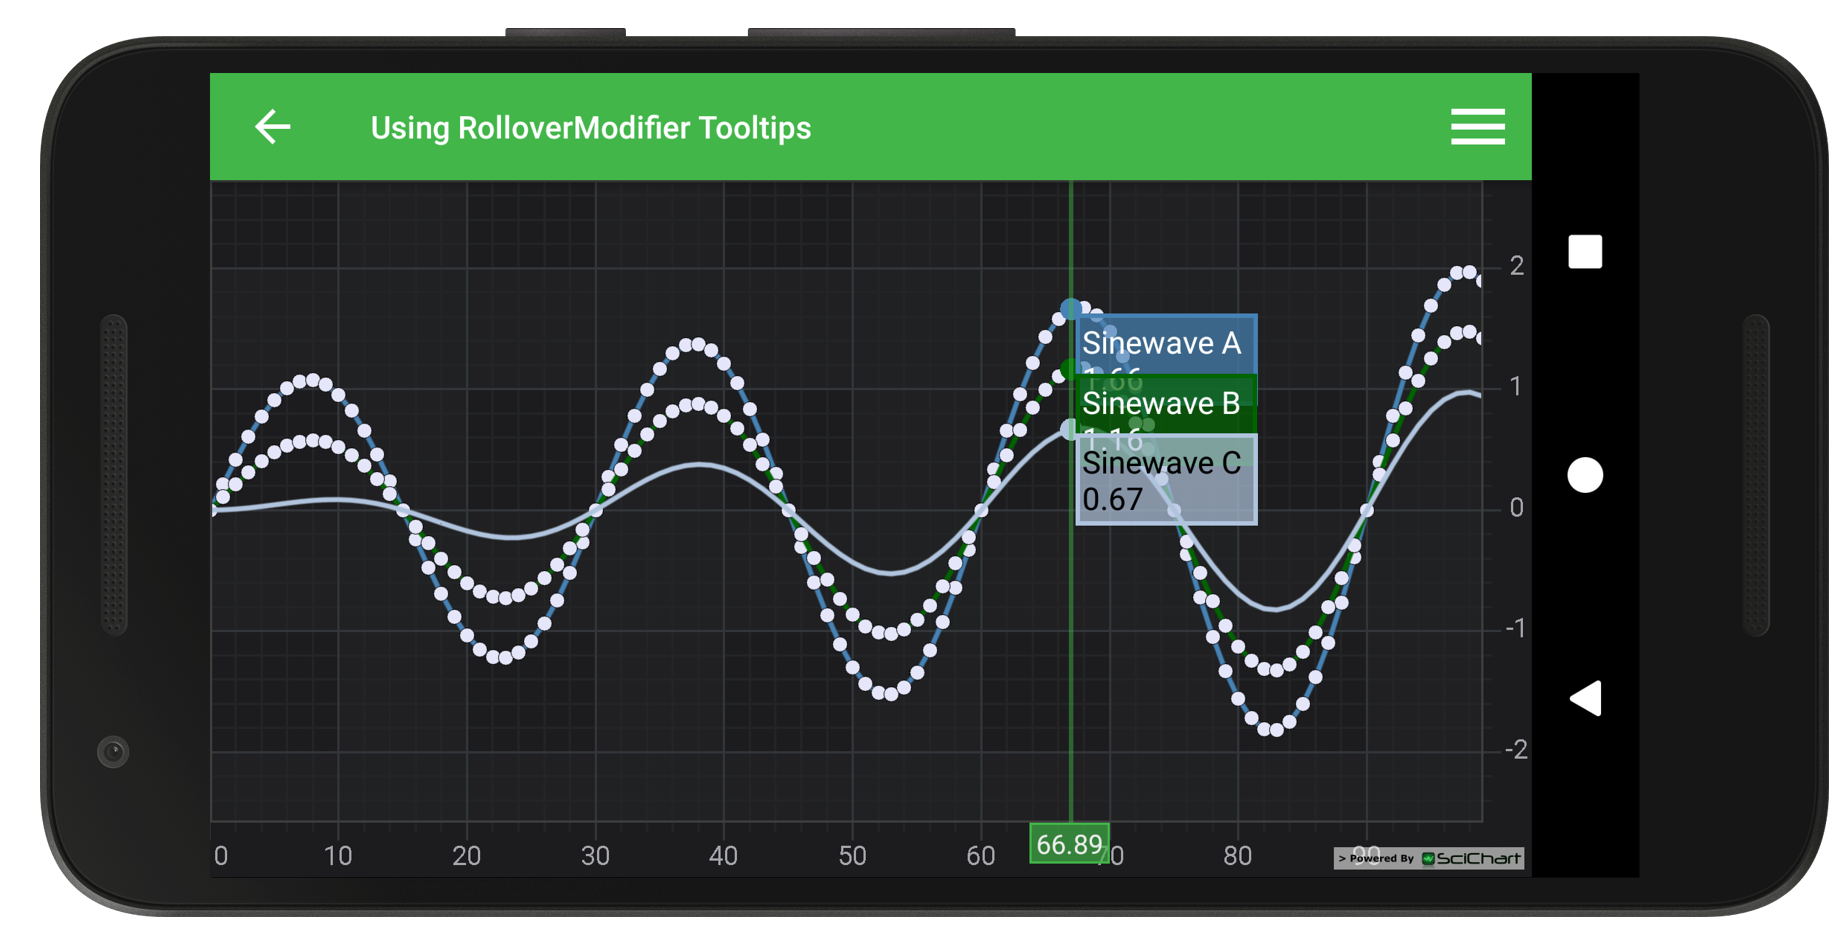
Demonstrates the use of the RolloverModifier, part of the ChartModifier API for getting information about Renderable Series and its displaying on tooltips.
Tip!
The SeriesInfo acts as a data-source for the data-point, and each SeriesInfo derived type contains:
– The X,Y values of the series under the cursor.
– The series color.
– The series name.
It can be extended or replaced by a custom SeriesInfo by creating your own SeriesInfoProvider for a Renderable Series.
The full source code for the Android Chart with Rollover Tooltips example is included below (Scroll down!).
Did you know you can also view the source code from one of the following sources as well?
<?xml version="1.0" encoding="utf-8"?><!--*************************************************************************-->
<!-- SCICHART® Copyright SciChart Ltd. 2011-2016. All rights reserved. -->
<!-- -->
<!-- Web: http://www.scichart.com -->
<!-- Support: support@scichart.com -->
<!-- Sales: sales@scichart.com -->
<!-- -->
<!-- example_single_chart_fragment.xml is part of the SCICHART® Examples. Permission is hereby granted -->
<!-- to modify, create derivative works, distribute and publish any part of this source -->
<!-- code whether for commercial, private or personal use. -->
<!-- -->
<!-- The SCICHART® examples are distributed in the hope that they will be useful, but -->
<!-- without any warranty. It is provided "AS IS" without warranty of any kind, either -->
<!-- expressed or implied. -->
<!--*************************************************************************-->
<LinearLayout xmlns:android="http://schemas.android.com/apk/res/android"
android:layout_width="match_parent"
android:layout_height="match_parent"
android:orientation="vertical">
<com.scichart.charting.visuals.SciChartSurface
android:id="@+id/chart"
android:layout_width="fill_parent"
android:layout_height="fill_parent" />
</LinearLayout>
//******************************************************************************
// SCICHART® Copyright SciChart Ltd. 2011-2017. All rights reserved.
//
// Web: http://www.scichart.com
// Support: support@scichart.com
// Sales: sales@scichart.com
//
// UsingRolloverModifierTooltipsFragment.java is part of the SCICHART® Examples. Permission is hereby granted
// to modify, create derivative works, distribute and publish any part of this source
// code whether for commercial, private or personal use.
//
// The SCICHART® examples are distributed in the hope that they will be useful, but
// without any warranty. It is provided "AS IS" without warranty of any kind, either
// expressed or implied.
//******************************************************************************
package com.scichart.examples.fragments;
import android.app.Dialog;
import android.content.Context;
import android.view.View;
import android.view.animation.DecelerateInterpolator;
import android.widget.AdapterView;
import android.widget.CompoundButton;
import android.widget.Spinner;
import com.scichart.charting.model.dataSeries.XyDataSeries;
import com.scichart.charting.modifiers.RolloverModifier;
import com.scichart.charting.modifiers.SourceMode;
import com.scichart.charting.visuals.SciChartSurface;
import com.scichart.charting.visuals.axes.IAxis;
import com.scichart.charting.visuals.pointmarkers.EllipsePointMarker;
import com.scichart.charting.visuals.renderableSeries.FastLineRenderableSeries;
import com.scichart.core.framework.UpdateSuspender;
import com.scichart.data.model.DoubleRange;
import com.scichart.drawing.utility.ColorUtil;
import com.scichart.examples.R;
import com.scichart.examples.components.SpinnerStringAdapter;
import com.scichart.examples.fragments.base.ExampleBaseFragment;
import com.scichart.examples.utils.EnumUtils;
import com.scichart.examples.utils.ItemSelectedListenerBase;
import com.scichart.examples.utils.ViewSettingsUtil;
import com.scichart.examples.utils.widgetgeneration.ImageViewWidget;
import com.scichart.examples.utils.widgetgeneration.Widget;
import java.util.ArrayList;
import java.util.Collections;
import java.util.List;
import butterknife.BindView;
import static java.util.Arrays.asList;
import static java.util.Collections.unmodifiableList;
public class UsingRolloverModifierTooltipsFragment extends ExampleBaseFragment {
private static final List<SourceMode> sourceModeValues = unmodifiableList(asList(SourceMode.values()));
private RolloverModifier rolloverModifier;
private int selectedSourceMode = 1; //1 = SourceMode.AllVisibleSeries
private boolean showTooltip = true;
private boolean showAxisLabels = true;
private boolean drawVerticalLine = true;
@BindView(R.id.chart)
SciChartSurface surface;
@Override
public List<Widget> getToolbarItems() {
return new ArrayList<Widget>() {
{
add(new ImageViewWidget.Builder().setId(R.drawable.example_toolbar_settings).setListener(new View.OnClickListener() {
@Override
public void onClick(View v) {
openSettingsDialog();
}
}).build());
}
};
}
@Override
protected void initExample() {
final IAxis xAxis = sciChartBuilder.newNumericAxis().build();
final IAxis yAxis = sciChartBuilder.newNumericAxis().withGrowBy(new DoubleRange(0.2d, 0.2d)).build();
rolloverModifier = new RolloverModifier();
rolloverModifier.setShowTooltip(showTooltip);
rolloverModifier.setShowAxisLabels(showAxisLabels);
rolloverModifier.setDrawVerticalLine(drawVerticalLine);
final XyDataSeries<Integer, Double> ds1 = sciChartBuilder.newXyDataSeries(Integer.class, Double.class).withSeriesName("Sinewave A").build();
final XyDataSeries<Integer, Double> ds2 = sciChartBuilder.newXyDataSeries(Integer.class, Double.class).withSeriesName("Sinewave B").build();
final XyDataSeries<Integer, Double> ds3 = sciChartBuilder.newXyDataSeries(Integer.class, Double.class).withSeriesName("Sinewave C").build();
double count = 100.0;
double k = 2 * Math.PI / 30.0;
for (int i = 0; i < (int) count; i++) {
double phi = k * i;
ds1.append(i, (1.0 + i / count) * Math.sin(phi));
ds2.append(i, (0.5 + i / count) * Math.sin(phi));
ds3.append(i, (i / count) * Math.sin(phi));
}
final FastLineRenderableSeries rs1 = sciChartBuilder.newLineSeries()
.withDataSeries(ds1)
.withStrokeStyle(ColorUtil.SteelBlue, 2)
.withPointMarker(sciChartBuilder.newPointMarker(new EllipsePointMarker())
.withSize(7, 7)
.withFill(ColorUtil.Lavender)
.build())
.build();
final FastLineRenderableSeries rs2 = sciChartBuilder.newLineSeries()
.withDataSeries(ds2)
.withStrokeStyle(ColorUtil.DarkGreen, 2)
.withPointMarker(sciChartBuilder.newPointMarker(new EllipsePointMarker())
.withSize(7, 7)
.withFill(ColorUtil.Lavender)
.build())
.build();
final FastLineRenderableSeries rs3 = sciChartBuilder.newLineSeries()
.withDataSeries(ds3)
.withStrokeStyle(ColorUtil.LightSteelBlue, 2, true)
.build();
UpdateSuspender.using(surface, new Runnable() {
@Override
public void run() {
Collections.addAll(surface.getXAxes(), xAxis);
Collections.addAll(surface.getYAxes(), yAxis);
Collections.addAll(surface.getRenderableSeries(), rs1, rs2, rs3);
Collections.addAll(surface.getChartModifiers(), rolloverModifier);
sciChartBuilder.newAnimator(rs1).withSweepTransformation().withInterpolator(new DecelerateInterpolator()).withDuration(2000).withStartDelay(350).start();
sciChartBuilder.newAnimator(rs2).withSweepTransformation().withInterpolator(new DecelerateInterpolator()).withDuration(2000).withStartDelay(350).start();
sciChartBuilder.newAnimator(rs3).withSweepTransformation().withInterpolator(new DecelerateInterpolator()).withDuration(2000).withStartDelay(350).start();
}
});
}
@Override
protected int getLayoutId() {
return R.layout.example_single_chart_fragment;
}
private void openSettingsDialog() {
final Dialog dialog = ViewSettingsUtil.createSettingsPopup(getActivity(), R.layout.example_using_rollover_modofier_tooltips_popup_layout);
Context context = dialog.getContext();
final SpinnerStringAdapter legendSourceAdapter = new SpinnerStringAdapter(context, EnumUtils.getEnumValuesArray(SourceMode.class));
final Spinner legendSourceSpinner = (Spinner) dialog.findViewById(R.id.legend_source_spinner_rollover);
legendSourceSpinner.setAdapter(legendSourceAdapter);
legendSourceSpinner.setSelection(selectedSourceMode);
legendSourceSpinner.setOnItemSelectedListener(new ItemSelectedListenerBase() {
@Override
public void onItemSelected(AdapterView<?> parent, View view, int position, long id) {
selectedSourceMode = position;
rolloverModifier.setSourceMode(sourceModeValues.get(selectedSourceMode));
}
});
ViewSettingsUtil.setUpSwitchCompat(dialog, R.id.show_tooltips_checkbox, showTooltip, new CompoundButton.OnCheckedChangeListener() {
@Override
public void onCheckedChanged(CompoundButton buttonView, boolean isChecked) {
showTooltip = isChecked;
rolloverModifier.setShowTooltip(showTooltip);
}
});
ViewSettingsUtil.setUpSwitchCompat(dialog, R.id.show_axis_labels_checkbox, showAxisLabels, new CompoundButton.OnCheckedChangeListener() {
@Override
public void onCheckedChanged(CompoundButton buttonView, boolean isChecked) {
showAxisLabels = isChecked;
rolloverModifier.setShowAxisLabels(showAxisLabels);
}
});
ViewSettingsUtil.setUpSwitchCompat(dialog, R.id.draw_vertical_line_checkbox, drawVerticalLine, new CompoundButton.OnCheckedChangeListener() {
@Override
public void onCheckedChanged(CompoundButton buttonView, boolean isChecked) {
drawVerticalLine = isChecked;
rolloverModifier.setDrawVerticalLine(drawVerticalLine);
}
});
dialog.show();
}
}