SciChart® the market leader in Fast WPF Charts, WPF 3D Charts, iOS Chart, Android Chart and JavaScript Chart Components
SciChart Android ships with ~90 Android Chart Examples which you can browse, play with, view the source-code and even export each SciChart Android Chart Example to a stand-alone Android Studio project. All of this is possible with the new and improved SciChart Android Examples Suite, which ships as part of our Android Charts SDK.
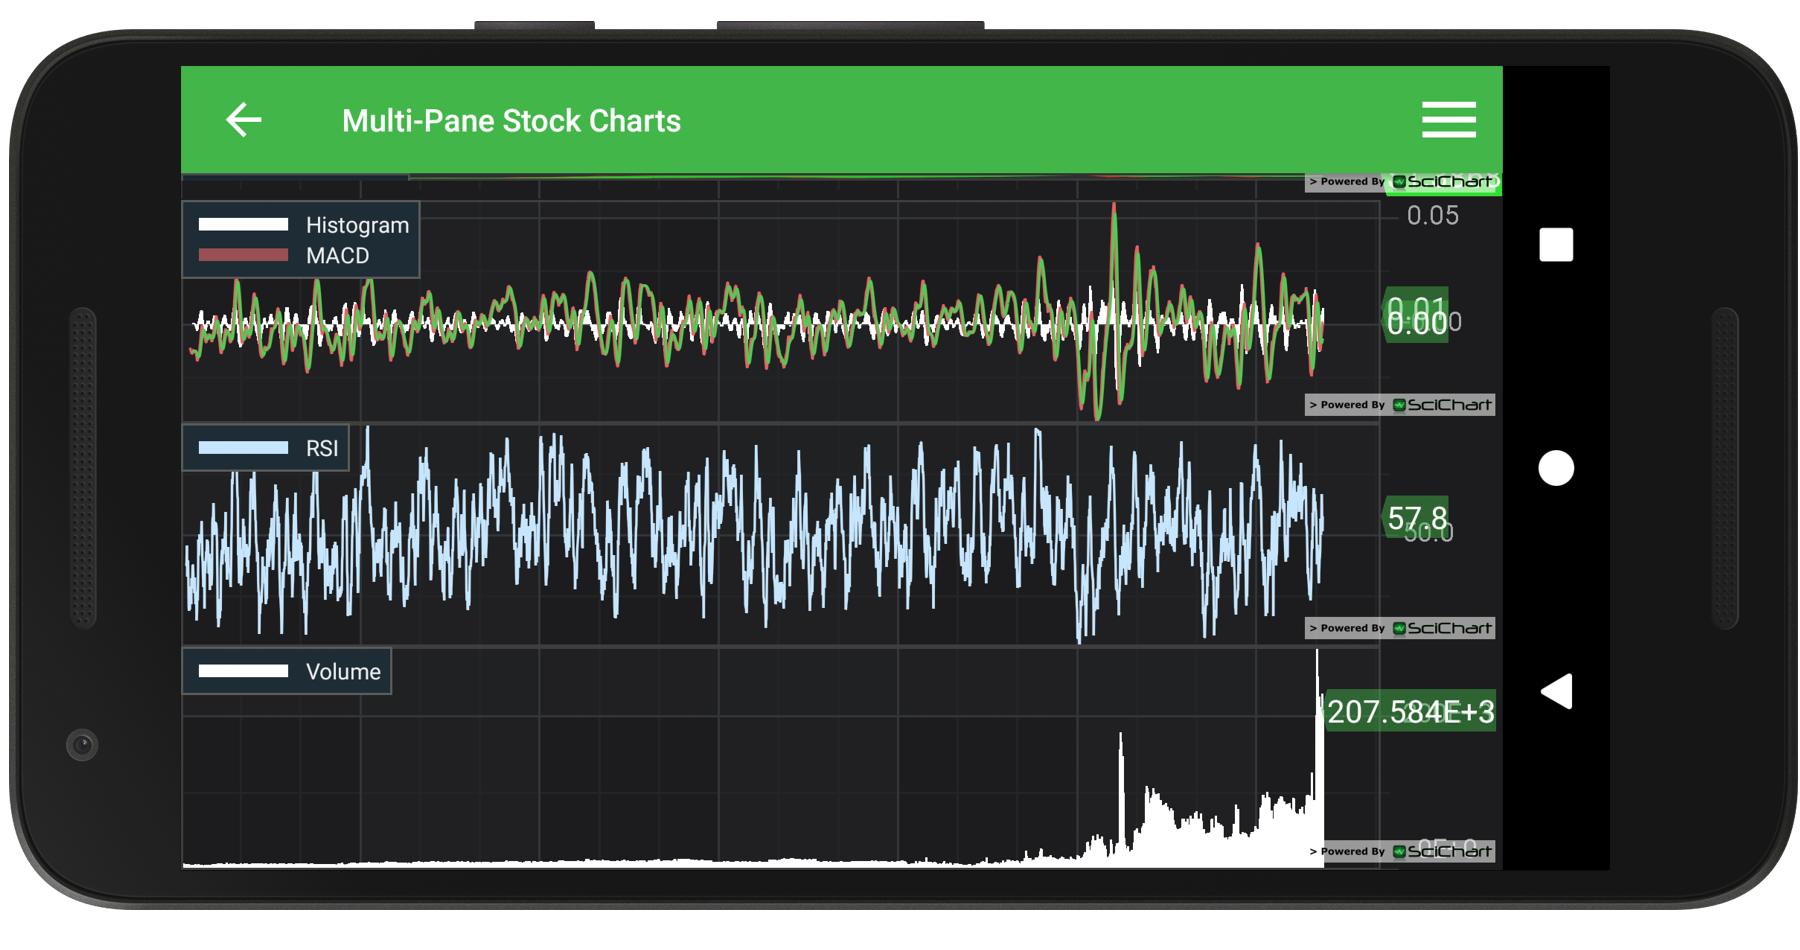
The Multi-Pane Stock Charts example demonstrates creating a static multi-panel stock chart with Volume and Indicator panes. All charts are synchronized by setting the same VisibleRange for their XAxes. The sizes of all X Axes are synchronized using the SciChartVerticalGroup helper class.
Example Usage
– The main(Price) chart can be scrolled dragging its X Axis. All the other charts are synchronized with it, so they will be scrolled too.
– Zoom to the data extents, double-tapping on any chart. The others will be zoomed to the data extents as well.
– Hover to see XY cursor values from all the charts
The full source code for the Android Multi Pane Stock Charts example is included below (Scroll down!).
Did you know you can also view the source code from one of the following sources as well?
//******************************************************************************
// SCICHART® Copyright SciChart Ltd. 2011-2021. All rights reserved.
//
// Web: http://www.scichart.com
// Support: support@scichart.com
// Sales: sales@scichart.com
//
// CreateMultiPaneStockChartsFragment.kt is part of SCICHART®, High Performance Scientific Charts
// For full terms and conditions of the license, see http://www.scichart.com/scichart-eula/
//
// This source code is protected by international copyright law. Unauthorized
// reproduction, reverse-engineering, or distribution of all or any portion of
// this source code is strictly prohibited.
//
// This source code contains confidential and proprietary trade secrets of
// SciChart Ltd., and should at no time be copied, transferred, sold,
// distributed or made available without express written permission.
//******************************************************************************
package com.scichart.examples.fragments.examples2d.createStockCharts.kt
import android.view.LayoutInflater
import android.view.View
import com.scichart.charting.Direction2D.XDirection
import com.scichart.charting.modifiers.AxisDragModifierBase.AxisDragMode.Pan
import com.scichart.charting.visuals.SciChartSurface
import com.scichart.charting.visuals.axes.AutoRange
import com.scichart.charting.visuals.axes.NumericAxis
import com.scichart.charting.visuals.synchronization.SciChartVerticalGroup
import com.scichart.data.model.DoubleRange
import com.scichart.examples.data.DataManager
import com.scichart.examples.data.MovingAverage
import com.scichart.examples.data.PriceSeries
import com.scichart.examples.databinding.ExampleMultipaneStockChartsFragmentBinding
import com.scichart.examples.fragments.base.ExampleBaseFragment
import com.scichart.examples.utils.scichartExtensions.*
import java.util.*
class CreateMultiPaneStockChartsFragment : ExampleBaseFragment<ExampleMultipaneStockChartsFragmentBinding>() {
private val verticalGroup = SciChartVerticalGroup()
private val sharedXRange = DoubleRange()
override fun showDefaultModifiersInToolbar(): Boolean = false
override fun inflateBinding(inflater: LayoutInflater): ExampleMultipaneStockChartsFragmentBinding {
return ExampleMultipaneStockChartsFragmentBinding.inflate(inflater)
}
override fun initExample(binding: ExampleMultipaneStockChartsFragmentBinding) {
val priceData = DataManager.getInstance().getPriceDataEurUsd(activity)
initPriceChart(binding.priceChart, priceData)
initMacdChart(binding.macdChart, priceData)
initRsiChart(binding.rsiChart, priceData)
initVolumeChart(binding.volumeChart, priceData)
}
private fun initPriceChart(surface: SciChartSurface, prices: PriceSeries) {
surface.suspendUpdates {
initChart(this, true)
val maLow = MovingAverage.movingAverage(prices.closeData, 50)
val maHigh = MovingAverage.movingAverage(prices.closeData, 200)
yAxes {
axis(createNumericAxis(PRICES, "$0.0000", true))
}
renderableSeries {
fastCandlestickRenderableSeries {
ohlcDataSeries<Date, Double>("EUR/USD") {
append(prices.dateData, prices.openData, prices.highData, prices.lowData, prices.closeData)
}
yAxisId = PRICES
}
fastLineRenderableSeries {
xyDataSeries<Date, Double>("Low Line") {
append(prices.dateData, maLow)
}
yAxisId = PRICES
strokeStyle = SolidPenStyle(0xFFFF3333)
}
fastLineRenderableSeries {
xyDataSeries<Date, Double>("High Line") {
append(prices.dateData, maHigh)
}
yAxisId = PRICES
strokeStyle = SolidPenStyle(0xFF33DD33)
}
}
annotations {
axisMarkerAnnotation { y1 = prices.closeData.last(); yAxisId = PRICES; background = 0xFFFF3333.drawable() }
axisMarkerAnnotation { y1 = maLow.last(); yAxisId = PRICES; background = 0xFFFF3333.drawable() }
axisMarkerAnnotation { y1 = maHigh.last(); yAxisId = PRICES; background = 0xFF33DD33.drawable() }
}
}
}
private fun initVolumeChart(surface: SciChartSurface, prices: PriceSeries) {
surface.suspendUpdates {
initChart(surface, false)
yAxes {
axis(createNumericAxis(VOLUME, "###E+0", false))
}
renderableSeries {
fastColumnRenderableSeries {
xyDataSeries<Date, Double>(VOLUME) {
append(prices.dateData, prices.volumeData.map(Long::toDouble))
}
yAxisId = VOLUME
}
}
annotations {
axisMarkerAnnotation { y1 = prices.volumeData.last().toDouble(); yAxisId = VOLUME }
}
}
}
private fun initRsiChart(surface: SciChartSurface, prices: PriceSeries) {
surface.suspendUpdates {
initChart(surface, false)
val rsi = MovingAverage.rsi(prices, 14)
yAxes {
axis(createNumericAxis(RSI, "0.0", false))
}
renderableSeries {
fastLineRenderableSeries {
xyDataSeries<Date, Double>(RSI) {
append(prices.dateData, rsi)
}
yAxisId = RSI
strokeStyle = SolidPenStyle(0xFFC6E6FF)
}
}
annotations {
axisMarkerAnnotation { y1 = rsi.last(); yAxisId = RSI }
}
}
}
private fun initMacdChart(surface: SciChartSurface, prices: PriceSeries) {
surface.suspendUpdates {
initChart(surface, false)
val macd = MovingAverage.macd(prices.closeData, 12, 25, 9)
yAxes {
axis(createNumericAxis(MACD, "0.00", false))
}
renderableSeries {
fastColumnRenderableSeries {
xyDataSeries<Date, Double>("Histogram") {
append(prices.dateData, macd.divergenceValues)
}
yAxisId = MACD
}
fastBandRenderableSeries {
xyyDataSeries<Date, Double>(MACD) {
append(prices.dateData, macd.macdValues, macd.signalValues)
}
yAxisId = MACD
}
}
annotations {
axisMarkerAnnotation { y1 = macd.divergenceValues.last(); yAxisId = MACD }
axisMarkerAnnotation { y1 = macd.macdValues.last(); yAxisId = MACD }
}
}
}
private fun initChart(surface: SciChartSurface, isMainPane: Boolean) {
surface.run {
xAxes {
categoryDateAxis {
visibility = if (isMainPane) View.VISIBLE else View.GONE
visibleRange = sharedXRange
growBy = DoubleRange(0.0, 0.05)
}
}
chartModifiers { modifierGroup(context) {
xAxisDragModifier { receiveHandledEvents = true; dragMode = Pan }
pinchZoomModifier { receiveHandledEvents = true; direction = XDirection }
zoomPanModifier { receiveHandledEvents = true }
zoomExtentsModifier { receiveHandledEvents = true }
legendModifier { setShowCheckboxes(false) }
}}
}
verticalGroup.addSurfaceToGroup(surface)
}
fun createNumericAxis(title: String, yAxisTextFormatting: String, isMainPane: Boolean): NumericAxis {
return NumericAxis(context).apply {
axisId = title
textFormatting = yAxisTextFormatting
autoRange = AutoRange.Always
minorsPerMajor = if (isMainPane) 4 else 2
maxAutoTicks = if (isMainPane) 8 else 4
growBy = if (isMainPane) DoubleRange(0.05, 0.05) else DoubleRange(0.0, 0.0)
}
}
companion object {
private const val VOLUME = "Volume"
private const val PRICES = "Prices"
private const val RSI = "RSI"
private const val MACD = "MACD"
}
}
//******************************************************************************
// SCICHART® Copyright SciChart Ltd. 2011-2021. All rights reserved.
//
// Web: http://www.scichart.com
// Support: support@scichart.com
// Sales: sales@scichart.com
//
// CreateMultiPaneStockChartsFragment.java is part of SCICHART®, High Performance Scientific Charts
// For full terms and conditions of the license, see http://www.scichart.com/scichart-eula/
//
// This source code is protected by international copyright law. Unauthorized
// reproduction, reverse-engineering, or distribution of all or any portion of
// this source code is strictly prohibited.
//
// This source code contains confidential and proprietary trade secrets of
// SciChart Ltd., and should at no time be copied, transferred, sold,
// distributed or made available without express written permission.
//******************************************************************************
package com.scichart.examples.fragments.examples2d.createStockCharts;
import android.view.LayoutInflater;
import android.view.View;
import androidx.annotation.NonNull;
import com.scichart.charting.ClipMode;
import com.scichart.charting.Direction2D;
import com.scichart.charting.model.AnnotationCollection;
import com.scichart.charting.model.RenderableSeriesCollection;
import com.scichart.charting.model.dataSeries.OhlcDataSeries;
import com.scichart.charting.model.dataSeries.XyDataSeries;
import com.scichart.charting.model.dataSeries.XyyDataSeries;
import com.scichart.charting.modifiers.AxisDragModifierBase;
import com.scichart.charting.visuals.SciChartSurface;
import com.scichart.charting.visuals.axes.AutoRange;
import com.scichart.charting.visuals.axes.CategoryDateAxis;
import com.scichart.charting.visuals.axes.NumericAxis;
import com.scichart.charting.visuals.renderableSeries.BaseRenderableSeries;
import com.scichart.charting.visuals.synchronization.SciChartVerticalGroup;
import com.scichart.core.utility.ListUtil;
import com.scichart.data.model.DoubleRange;
import com.scichart.examples.data.DataManager;
import com.scichart.examples.data.MovingAverage;
import com.scichart.examples.data.PriceSeries;
import com.scichart.examples.databinding.ExampleMultipaneStockChartsFragmentBinding;
import com.scichart.examples.fragments.base.ExampleBaseFragment;
import com.scichart.extensions.builders.SciChartBuilder;
import java.util.Collections;
import java.util.Date;
public class CreateMultiPaneStockChartsFragment extends ExampleBaseFragment<ExampleMultipaneStockChartsFragmentBinding> {
private static final String VOLUME = "Volume";
private static final String PRICES = "Prices";
private static final String RSI = "RSI";
private static final String MACD = "MACD";
private final SciChartVerticalGroup verticalGroup = new SciChartVerticalGroup();
private final DoubleRange sharedXRange = new DoubleRange();
@Override
public boolean showDefaultModifiersInToolbar() {
return false;
}
@NonNull
@Override
protected ExampleMultipaneStockChartsFragmentBinding inflateBinding(@NonNull LayoutInflater inflater) {
return ExampleMultipaneStockChartsFragmentBinding.inflate(inflater);
}
@Override
protected void initExample(ExampleMultipaneStockChartsFragmentBinding binding) {
final PriceSeries priceData = DataManager.getInstance().getPriceDataEurUsd(getActivity());
final PricePaneModel pricePaneModel = new PricePaneModel(sciChartBuilder, priceData);
final MacdPaneModel macdPaneModel = new MacdPaneModel(sciChartBuilder, priceData);
final RsiPaneModel rsiPaneModel = new RsiPaneModel(sciChartBuilder, priceData);
final VolumePaneModel volumePaneModel = new VolumePaneModel(sciChartBuilder, priceData);
initChart(binding.priceChart, pricePaneModel, true);
initChart(binding.macdChart, macdPaneModel, false);
initChart(binding.rsiChart, rsiPaneModel, false);
initChart(binding.volumeChart, volumePaneModel, false);
}
private void initChart(SciChartSurface surface, BasePaneModel model, boolean isMainPane) {
final CategoryDateAxis xAxis = sciChartBuilder.newCategoryDateAxis()
.withVisibility(isMainPane ? View.VISIBLE : View.GONE)
.withVisibleRange(sharedXRange)
.withGrowBy(0, 0.05)
.build();
surface.getXAxes().add(xAxis);
surface.getYAxes().add(model.yAxis);
surface.getRenderableSeries().addAll(model.renderableSeries);
surface.getChartModifiers().add(sciChartBuilder
.newModifierGroup()
.withXAxisDragModifier().withReceiveHandledEvents(true).withDragMode(AxisDragModifierBase.AxisDragMode.Pan).withClipModeX(ClipMode.StretchAtExtents).build()
.withPinchZoomModifier().withReceiveHandledEvents(true).withXyDirection(Direction2D.XDirection).build()
.withZoomPanModifier().withReceiveHandledEvents(true).build()
.withZoomExtentsModifier().withReceiveHandledEvents(true).build()
.withLegendModifier().withShowCheckBoxes(false).build()
.build());
surface.setAnnotations(model.annotations);
verticalGroup.addSurfaceToGroup(surface);
}
private abstract static class BasePaneModel {
public final RenderableSeriesCollection renderableSeries = new RenderableSeriesCollection();
public final AnnotationCollection annotations = new AnnotationCollection();
public final NumericAxis yAxis;
public final String title;
protected BasePaneModel(SciChartBuilder builder, String title, String yAxisTextFormatting, boolean isMainPane) {
this.title = title;
this.yAxis = builder.newNumericAxis()
.withAxisId(title)
.withTextFormatting(yAxisTextFormatting)
.withAutoRangeMode(AutoRange.Always)
.withMinorsPerMajor(isMainPane ? 4 : 2)
.withMaxAutoTicks(isMainPane ? 8 : 4)
.withGrowBy(isMainPane ? new DoubleRange(0.05d, 0.05d) : new DoubleRange(0d, 0d))
.build();
}
final void addRenderableSeries(BaseRenderableSeries renderableSeries) {
renderableSeries.setClipToBounds(true);
this.renderableSeries.add(renderableSeries);
}
}
private static class PricePaneModel extends BasePaneModel {
public PricePaneModel(SciChartBuilder builder, PriceSeries prices) {
super(builder, PRICES, "$0.0000", true);
// Add the main OHLC chart
final OhlcDataSeries<Date, Double> stockPrices = builder.newOhlcDataSeries(Date.class, Double.class).withSeriesName("EUR/USD").build();
stockPrices.append(prices.getDateData(), prices.getOpenData(), prices.getHighData(), prices.getLowData(), prices.getCloseData());
addRenderableSeries(builder.newCandlestickSeries().withDataSeries(stockPrices).withYAxisId(PRICES).build());
final XyDataSeries<Date, Double> maLow = builder.newXyDataSeries(Date.class, Double.class).withSeriesName("Low Line").build();
maLow.append(prices.getDateData(), MovingAverage.movingAverage(prices.getCloseData(), 50));
addRenderableSeries(builder.newLineSeries().withDataSeries(maLow).withStrokeStyle(0xFFFF3333, 1f).withYAxisId(PRICES).build());
final XyDataSeries<Date, Double> maHigh = builder.newXyDataSeries(Date.class, Double.class).withSeriesName("High Line").build();
maHigh.append(prices.getDateData(), MovingAverage.movingAverage(prices.getCloseData(), 200));
addRenderableSeries(builder.newLineSeries().withDataSeries(maHigh).withStrokeStyle(0xFF33DD33, 1f).withYAxisId(PRICES).build());
Collections.addAll(annotations,
builder.newAxisMarkerAnnotation().withY1(stockPrices.getYValues().get(stockPrices.getCount() - 1)).withBackgroundColor(0xFFFF3333).withYAxisId(PRICES).build(),
builder.newAxisMarkerAnnotation().withY1(maLow.getYValues().get(maLow.getCount() - 1)).withBackgroundColor(0xFFFF3333).withYAxisId(PRICES).build(),
builder.newAxisMarkerAnnotation().withY1(maHigh.getYValues().get(maHigh.getCount() - 1)).withBackgroundColor(0xFF33DD33).withYAxisId(PRICES).build());
}
}
private static class VolumePaneModel extends BasePaneModel {
public VolumePaneModel(SciChartBuilder builder, PriceSeries prices) {
super(builder, VOLUME, "###E+0", false);
final XyDataSeries<Date, Double> volumePrices = builder.newXyDataSeries(Date.class, Double.class).withSeriesName(VOLUME).build();
volumePrices.append(prices.getDateData(), ListUtil.select(prices.getVolumeData(), Long::doubleValue));
addRenderableSeries(builder.newColumnSeries().withDataSeries(volumePrices).withYAxisId(VOLUME).build());
Collections.addAll(annotations,
builder.newAxisMarkerAnnotation().withY1(volumePrices.getYValues().get(volumePrices.getCount() - 1)).withYAxisId(VOLUME).build());
}
}
private static class RsiPaneModel extends BasePaneModel {
public RsiPaneModel(SciChartBuilder builder, PriceSeries prices) {
super(builder, RSI, "0.0", false);
final XyDataSeries<Date, Double> rsiSeries = builder.newXyDataSeries(Date.class, Double.class).withSeriesName(RSI).build();
rsiSeries.append(prices.getDateData(), MovingAverage.rsi(prices, 14));
addRenderableSeries(builder.newLineSeries().withDataSeries(rsiSeries).withStrokeStyle(0xFFC6E6FF, 1f).withYAxisId(RSI).build());
Collections.addAll(annotations,
builder.newAxisMarkerAnnotation().withY1(rsiSeries.getYValues().get(rsiSeries.getCount() - 1)).withYAxisId(RSI).build());
}
}
private static class MacdPaneModel extends BasePaneModel {
public MacdPaneModel(SciChartBuilder builder, PriceSeries prices) {
super(builder, MACD, "0.00", false);
final MovingAverage.MacdPoints macdPoints = MovingAverage.macd(prices.getCloseData(), 12, 25, 9);
final XyDataSeries<Date, Double> histogramDataSeries = builder.newXyDataSeries(Date.class, Double.class).withSeriesName("Histogram").build();
histogramDataSeries.append(prices.getDateData(), macdPoints.divergenceValues);
addRenderableSeries(builder.newColumnSeries().withDataSeries(histogramDataSeries).withYAxisId(MACD).build());
final XyyDataSeries<Date, Double> macdDataSeries = builder.newXyyDataSeries(Date.class, Double.class).withSeriesName(MACD).build();
macdDataSeries.append(prices.getDateData(), macdPoints.macdValues, macdPoints.signalValues);
addRenderableSeries(builder.newBandSeries().withDataSeries(macdDataSeries).withYAxisId(MACD).build());
Collections.addAll(annotations,
builder.newAxisMarkerAnnotation().withY1(histogramDataSeries.getYValues().get(histogramDataSeries.getCount() - 1)).withYAxisId(MACD).build(),
builder.newAxisMarkerAnnotation().withY1(macdDataSeries.getYValues().get(macdDataSeries.getCount() - 1)).withYAxisId(MACD).build());
}
}
}