SciChart® the market leader in Fast WPF Charts, WPF 3D Charts, iOS Chart, Android Chart and JavaScript Chart Components
SciChart Android ships with ~90Â Android Chart Examples which you can browse, play with, view the source-code and even export each SciChart Android Chart Example to a stand-alone Android Studio project. All of this is possible with the new and improved SciChart Android Examples Suite, which ships as part of our Android Charts SDK.
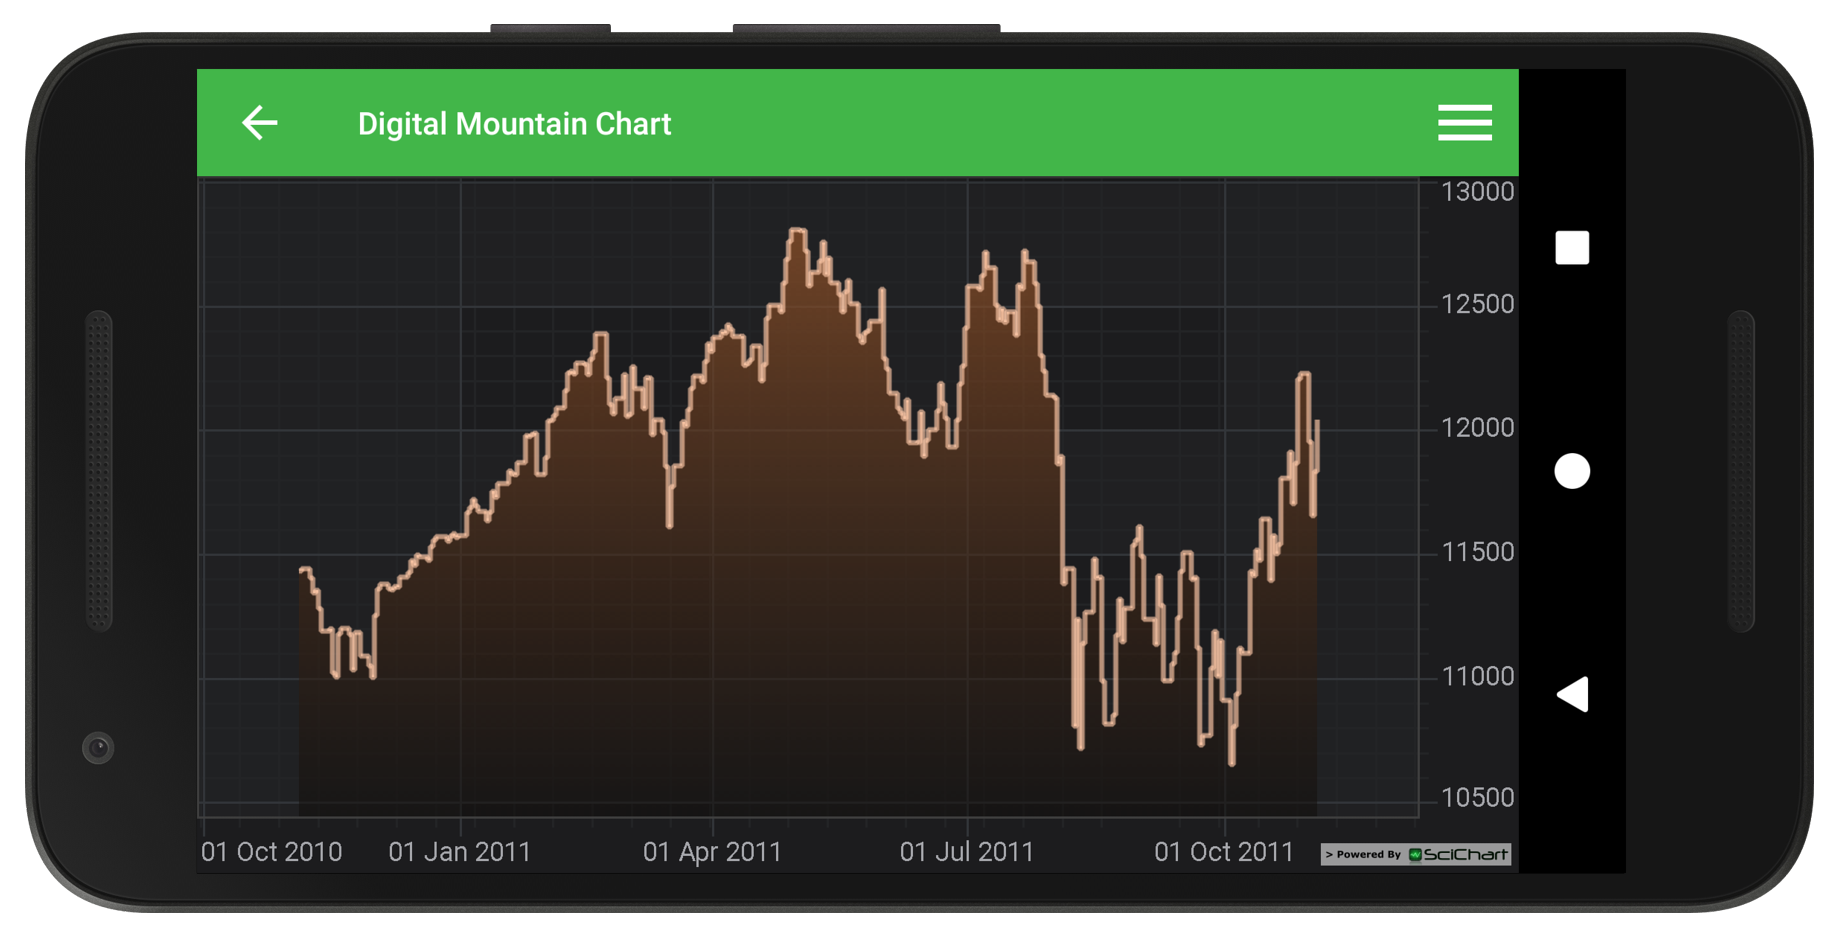
Generates a Digital Mountain (Area) Chart in code calling the setIsDigitalLine(True) method on a FastMountainRenderableSeries.
Digital mountain charts can be used to render an XyDataSeries (which contains one X-point and one Y-point), XyyDataSeries (renders Y values), XyzDataSeries, HlDataSeries and OhlcDataSeries(renders Close values).
Tips!
To alter the line color, provide a pen by the setStrokeStyle() method. Calling the setAreaStyle() alters the fill. The setIsDigitalLine() method makes the series digital. The Mountain-Series supports semi-transparent and gradient fills and looks great!
The full source code for the Android Digital Mountain Chart example is included below (Scroll down!).
Did you know you can also view the source code from one of the following sources as well?
//******************************************************************************
// SCICHART® Copyright SciChart Ltd. 2011-2017. All rights reserved.
//
// Web: http://www.scichart.com
// Support: support@scichart.com
// Sales: sales@scichart.com
//
// DigitalMountainChartFragment.java is part of the SCICHART® Examples. Permission is hereby granted
// to modify, create derivative works, distribute and publish any part of this source
// code whether for commercial, private or personal use.
//
// The SCICHART® examples are distributed in the hope that they will be useful, but
// without any warranty. It is provided "AS IS" without warranty of any kind, either
// expressed or implied.
//******************************************************************************
package com.scichart.examples.fragments;
import android.view.animation.DecelerateInterpolator;
import com.scichart.charting.model.dataSeries.IXyDataSeries;
import com.scichart.charting.visuals.SciChartSurface;
import com.scichart.charting.visuals.axes.IAxis;
import com.scichart.charting.visuals.renderableSeries.FastMountainRenderableSeries;
import com.scichart.core.framework.UpdateSuspender;
import com.scichart.data.model.DoubleRange;
import com.scichart.examples.R;
import com.scichart.examples.data.DataManager;
import com.scichart.examples.data.PriceSeries;
import com.scichart.examples.fragments.base.ExampleBaseFragment;
import java.util.Collections;
import java.util.Date;
import butterknife.BindView;
public class DigitalMountainChartFragment extends ExampleBaseFragment {
@BindView(R.id.chart)
SciChartSurface surface;
@Override
protected int getLayoutId() {
return R.layout.example_single_chart_fragment;
}
@Override
protected void initExample() {
final IAxis xAxis = sciChartBuilder.newDateAxis().withGrowBy(new DoubleRange(0.1d, 0.1d)).build();
final IAxis yAxis = sciChartBuilder.newNumericAxis().withGrowBy(new DoubleRange(0.1d, 0.1d)).build();
final IXyDataSeries<Date, Double> dataSeries = sciChartBuilder.newXyDataSeries(Date.class, Double.class).build();
final PriceSeries priceData = DataManager.getInstance().getPriceDataIndu(getActivity());
dataSeries.append(priceData.getDateData(), priceData.getCloseData());
final FastMountainRenderableSeries rSeries = sciChartBuilder.newMountainSeries()
.withDataSeries(dataSeries)
.withIsDigitalLine(true)
.withStrokeStyle(0xAAFFC9A8, 1, true)
.withAreaFillLinearGradientColors(0xAAFF8D42, 0x88090E11)
.build();
UpdateSuspender.using(surface, new Runnable() {
@Override
public void run() {
Collections.addAll(surface.getXAxes(), xAxis);
Collections.addAll(surface.getYAxes(), yAxis);
Collections.addAll(surface.getRenderableSeries(), rSeries);
Collections.addAll(surface.getChartModifiers(), sciChartBuilder.newModifierGroupWithDefaultModifiers().build());
sciChartBuilder.newAnimator(rSeries).withWaveTransformation().withInterpolator(new DecelerateInterpolator()).withDuration(3000).withStartDelay(350).start();
}
});
}
}