SciChart® the market leader in Fast WPF Charts, WPF 3D Charts, iOS Chart, Android Chart and JavaScript Chart Components
SciChart Android ships with ~90Â Android Chart Examples which you can browse, play with, view the source-code and even export each SciChart Android Chart Example to a stand-alone Android Studio project. All of this is possible with the new and improved SciChart Android Examples Suite, which ships as part of our Android Charts SDK.
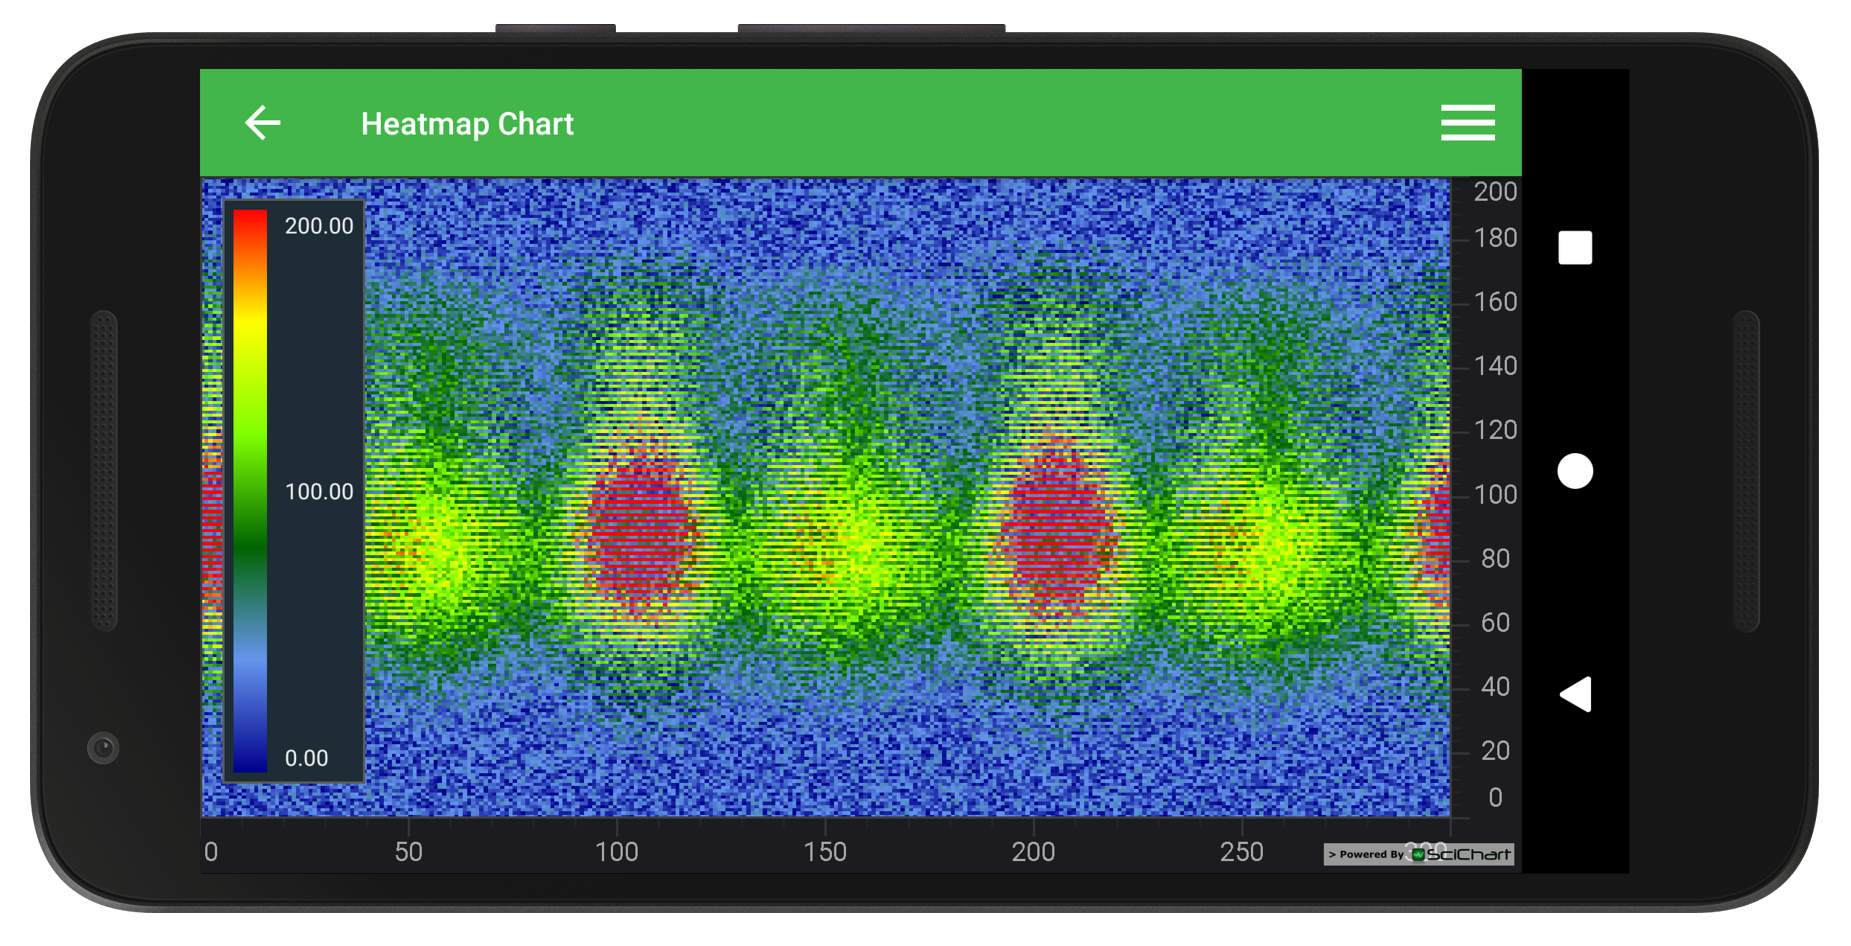
Demonstrates how to use FastUniformHeatmapRenderableSeries and create a real-time Heatmap in SciChart for Android.
Android Heatmap Charts can be used to visualize a variety of scientific and statistical data. Display a real-time spectrogram (Fourier Transform plus Time) of audio data. To overlay areas of heat on a background image such as a map or image, or to quickly bring to life 2-dimensional data and show the relative intensities via the heat color.
The FastUniformHeatmapRenderableSeries requires an UniformHeatmapDataSeries, which contains 1D array with heatmap values and ColorMap instance which allows to map values to colors.
In this example you also can tap and drag on the chart to see the animated-zoom performance while the heatmap is updating.
Tip!
You can enable drawing of heatmap value inside each cell by calling setDrawTextInCell(True)
The full source code for the Android Heatmap Chart example is included below (Scroll down!).
Did you know you can also view the source code from one of the following sources as well?
//******************************************************************************
// SCICHART® Copyright SciChart Ltd. 2011-2017. All rights reserved.
//
// Web: http://www.scichart.com
// Support: support@scichart.com
// Sales: sales@scichart.com
//
// HeatmapChartFragment.java is part of the SCICHART® Examples. Permission is hereby granted
// to modify, create derivative works, distribute and publish any part of this source
// code whether for commercial, private or personal use.
//
// The SCICHART® examples are distributed in the hope that they will be useful, but
// without any warranty. It is provided "AS IS" without warranty of any kind, either
// expressed or implied.
//******************************************************************************
package com.scichart.examples.fragments;
import com.scichart.charting.model.dataSeries.UniformHeatmapDataSeries;
import com.scichart.charting.modifiers.ModifierGroup;
import com.scichart.charting.visuals.SciChartHeatmapColourMap;
import com.scichart.charting.visuals.SciChartSurface;
import com.scichart.charting.visuals.axes.NumericAxis;
import com.scichart.charting.visuals.renderableSeries.ColorMap;
import com.scichart.charting.visuals.renderableSeries.FastUniformHeatmapRenderableSeries;
import com.scichart.core.framework.UpdateSuspender;
import com.scichart.core.model.DoubleValues;
import com.scichart.core.model.IValues;
import com.scichart.examples.R;
import com.scichart.examples.fragments.base.ExampleBaseFragment;
import java.util.ArrayList;
import java.util.Collections;
import java.util.List;
import java.util.Random;
import java.util.concurrent.Executors;
import java.util.concurrent.ScheduledExecutorService;
import java.util.concurrent.ScheduledFuture;
import java.util.concurrent.TimeUnit;
import butterknife.BindView;
import static com.scichart.drawing.utility.ColorUtil.Chartreuse;
import static com.scichart.drawing.utility.ColorUtil.CornflowerBlue;
import static com.scichart.drawing.utility.ColorUtil.DarkBlue;
import static com.scichart.drawing.utility.ColorUtil.DarkGreen;
import static com.scichart.drawing.utility.ColorUtil.Red;
import static com.scichart.drawing.utility.ColorUtil.Yellow;
public class HeatmapChartFragment extends ExampleBaseFragment {
private static final int WIDTH = 200, HEIGHT = 300;
private static final int SERIES_PER_PERIOD = 30;
private static final long TIME_INTERVAL = 40;
private final ScheduledExecutorService scheduledExecutorService = Executors.newSingleThreadScheduledExecutor();
private ScheduledFuture<?> schedule;
private final UniformHeatmapDataSeries<Integer, Integer, Double> dataSeries = new UniformHeatmapDataSeries<>(Integer.class, Integer.class, Double.class, WIDTH, HEIGHT);
private int timerIndex = 0;
private final List<IValues<Double>> valuesList = new ArrayList<>(SERIES_PER_PERIOD);
@BindView(R.id.chart)
SciChartSurface chart;
@BindView(R.id.heatmapColourMap)
SciChartHeatmapColourMap colourMap;
@Override
protected int getLayoutId() {
return R.layout.example_heatmap_chart_fragment;
}
@Override
protected void initExample() {
final NumericAxis xAxis = sciChartBuilder.newNumericAxis().build();
final NumericAxis yAxis = sciChartBuilder.newNumericAxis().build();
final FastUniformHeatmapRenderableSeries heatmapRenderableSeries = sciChartBuilder.newUniformHeatmap()
.withColorMap(new ColorMap(new int[]{DarkBlue, CornflowerBlue, DarkGreen, Chartreuse, Yellow, Red}, new float[]{0f, 0.2f, 0.4f, 0.6f, 0.8f, 1}))
.withMinimum(0)
.withMaximum(200)
.withDataSeries(dataSeries)
.build();
for (int i = 0; i < SERIES_PER_PERIOD; i++) {
valuesList.add(createValues(i));
}
colourMap.setMinimum(heatmapRenderableSeries.getMinimum());
colourMap.setMaximum(heatmapRenderableSeries.getMaximum());
colourMap.setColorMap(heatmapRenderableSeries.getColorMap());
Collections.addAll(chart.getXAxes(), xAxis);
Collections.addAll(chart.getYAxes(), yAxis);
Collections.addAll(chart.getRenderableSeries(), heatmapRenderableSeries);
ModifierGroup modifiers = sciChartBuilder.newModifierGroupWithDefaultModifiers()
.withCursorModifier().withShowTooltip(true).withReceiveHandledEvents(true).build()
.build();
Collections.addAll(chart.getChartModifiers(), modifiers);
schedule = scheduledExecutorService.scheduleWithFixedDelay(new Runnable() {
@Override
public void run() {
UpdateSuspender.using(chart, updateDataRunnable);
}
}, 0, TIME_INTERVAL, TimeUnit.MILLISECONDS);
}
private final Runnable updateDataRunnable = new Runnable() {
@Override
public void run() {
final IValues<Double> values = valuesList.get(timerIndex % SERIES_PER_PERIOD);
dataSeries.updateZValues(values);
timerIndex++;
}
};
private static IValues<Double> createValues(int index) {
final DoubleValues values = new DoubleValues(WIDTH * HEIGHT);
final Random random = new Random();
final double angle = Math.PI * 2 * index / SERIES_PER_PERIOD;
final double cx =150, cy = 100;
for (int y = 0; y < HEIGHT; y++) {
for (int x = 0; x < WIDTH; x++) {
final double v = (1 + Math.sin(y * 0.04 + angle)) * 50 + (1 + Math.sin(x * 0.1 + angle)) * 50 * (1 + Math.sin(angle * 2));
final double r = Math.sqrt((y - cx) * (y - cx) + (x - cy) * (x - cy));
final double exp = Math.max(0, 1 - r * 0.008);
values.add(v * exp + random.nextDouble() * 50);
}
}
return values;
}
@Override
public void onDestroyView() {
super.onDestroyView();
schedule.cancel(true);
}
}