SciChart® the market leader in Fast WPF Charts, WPF 3D Charts, iOS Chart, Android Chart and JavaScript Chart Components
SciChart Android ships with ~90Â Android Chart Examples which you can browse, play with, view the source-code and even export each SciChart Android Chart Example to a stand-alone Android Studio project. All of this is possible with the new and improved SciChart Android Examples Suite, which ships as part of our Android Charts SDK.
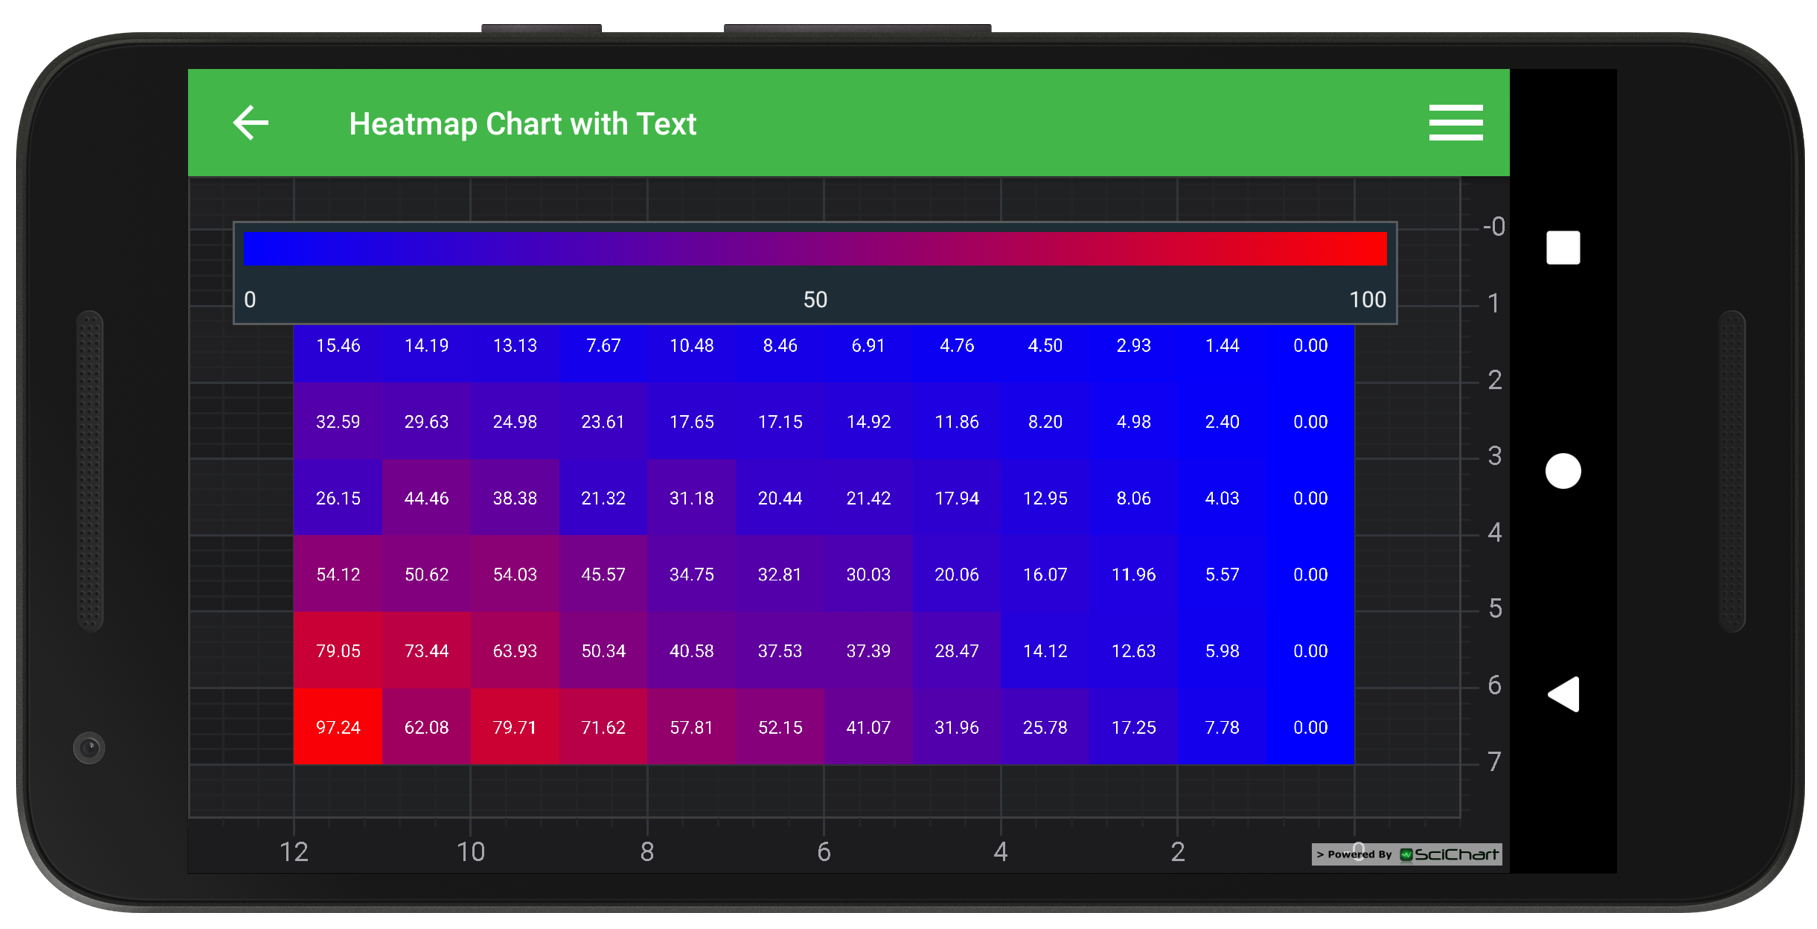
Demonstrates how to use FastUniformHeatmapRenderableSeries and create a *Heatmap Chart with Text in the cells* in SciChart for Android.
The FastUniformHeatmapRenderableSeries requires an UniformHeatmapDataSeries, which contains 1D array with heatmap values and ColorMap instance which allows to map values to colors.
Tip!
You can customize style of text in cells by calling setCellTextStyle() method.
The full source code for the Android Heatmap Chart with Text example is included below (Scroll down!).
Did you know you can also view the source code from one of the following sources as well?
<!--*************************************************************************-->
<!-- SCICHART® Copyright SciChart Ltd. 2011-2016. All rights reserved. -->
<!-- -->
<!-- Web: http://www.scichart.com -->
<!-- Support: support@scichart.com -->
<!-- Sales: sales@scichart.com -->
<!-- -->
<!-- example_heatmap_with_text_fragment.xml is part of the SCICHART® Examples. Permission is hereby granted -->
<!-- to modify, create derivative works, distribute and publish any part of this source -->
<!-- code whether for commercial, private or personal use. -->
<!-- -->
<!-- The SCICHART® examples are distributed in the hope that they will be useful, but -->
<!-- without any warranty. It is provided "AS IS" without warranty of any kind, either -->
<!-- expressed or implied. -->
<!--*************************************************************************-->
<FrameLayout xmlns:android="http://schemas.android.com/apk/res/android"
xmlns:tools="http://schemas.android.com/tools"
android:layout_width="match_parent"
android:layout_height="match_parent"
tools:context=".fragments.HeatmapWithTextFragment">
<com.scichart.charting.visuals.SciChartSurface
android:id="@+id/chart"
android:layout_width="match_parent"
android:layout_height="match_parent" />
<com.scichart.charting.visuals.SciChartHeatmapColourMap
android:id="@+id/heatmapColourMap"
android:layout_width="match_parent"
android:layout_height="wrap_content"
android:layout_marginBottom="30dp"
android:layout_marginEnd="50dp"
android:layout_marginStart="20dp"
android:layout_marginTop="20dp"
android:orientation="horizontal" />
</FrameLayout>
//******************************************************************************
// SCICHART® Copyright SciChart Ltd. 2011-2017. All rights reserved.
//
// Web: http://www.scichart.com
// Support: support@scichart.com
// Sales: sales@scichart.com
//
// HeatmapWithTextFragment.java is part of the SCICHART® Examples. Permission is hereby granted
// to modify, create derivative works, distribute and publish any part of this source
// code whether for commercial, private or personal use.
//
// The SCICHART® examples are distributed in the hope that they will be useful, but
// without any warranty. It is provided "AS IS" without warranty of any kind, either
// expressed or implied.
//******************************************************************************
package com.scichart.examples.fragments;
import com.scichart.charting.model.dataSeries.IDataSeries;
import com.scichart.charting.model.dataSeries.UniformHeatmapDataSeries;
import com.scichart.charting.visuals.SciChartHeatmapColourMap;
import com.scichart.charting.visuals.SciChartSurface;
import com.scichart.charting.visuals.axes.NumericAxis;
import com.scichart.charting.visuals.renderableSeries.FastUniformHeatmapRenderableSeries;
import com.scichart.drawing.utility.ColorUtil;
import com.scichart.examples.R;
import com.scichart.examples.fragments.base.ExampleBaseFragment;
import java.text.DecimalFormat;
import java.util.Collections;
import java.util.Random;
import butterknife.BindView;
public class HeatmapWithTextFragment extends ExampleBaseFragment {
@BindView(R.id.chart)
SciChartSurface chart;
@BindView(R.id.heatmapColourMap)
SciChartHeatmapColourMap colourMap;
@Override
protected int getLayoutId() {
return R.layout.example_heatmap_with_text_fragment;
}
@Override
protected void initExample() {
final NumericAxis xAxis = sciChartBuilder.newNumericAxis()
.withGrowBy(0.1, 0.1)
.withFlipCoordinates(true)
.build();
final NumericAxis yAxis = sciChartBuilder.newNumericAxis()
.withGrowBy(0.1, 0.1)
.withFlipCoordinates(true)
.build();
final FastUniformHeatmapRenderableSeries heatmapRenderableSeries = sciChartBuilder.newUniformHeatmap()
.withMinimum(0)
.withMaximum(100)
.withCellTextStyle(sciChartBuilder.newFont().withTextSize(8).withTextColor(ColorUtil.White).build())
.withDrawTextInCell(true)
.withDataSeries(createDataSeries())
.build();
colourMap.setMinimum(heatmapRenderableSeries.getMinimum());
colourMap.setMaximum(heatmapRenderableSeries.getMaximum());
colourMap.setColorMap(heatmapRenderableSeries.getColorMap());
colourMap.setTextFormat(new DecimalFormat("0.##"));
Collections.addAll(chart.getXAxes(), xAxis);
Collections.addAll(chart.getYAxes(), yAxis);
Collections.addAll(chart.getRenderableSeries(), heatmapRenderableSeries);
Collections.addAll(chart.getChartModifiers(), sciChartBuilder.newModifierGroupWithDefaultModifiers().build());
}
private IDataSeries createDataSeries() {
final int w = 12;
final int h = 7;
final UniformHeatmapDataSeries<Integer, Integer, Double> dataSeries = new UniformHeatmapDataSeries<>(Integer.class, Integer.class, Double.class, w, h);
final Random random = new Random();
for (int x = 0; x < w; x++) {
for (int y = 0; y < h; y++) {
dataSeries.updateZAt(x, y, Math.pow(random.nextDouble(), 0.15) * x / (w - 1) * y / (h - 1) * 100);
}
}
return dataSeries;
}
}