SciChart® the market leader in Fast WPF Charts, WPF 3D Charts, iOS Chart, Android Chart and JavaScript Chart Components
SciChart Android ships with ~90 Android Chart Examples which you can browse, play with, view the source-code and even export each SciChart Android Chart Example to a stand-alone Android Studio project. All of this is possible with the new and improved SciChart Android Examples Suite, which ships as part of our Android Charts SDK.
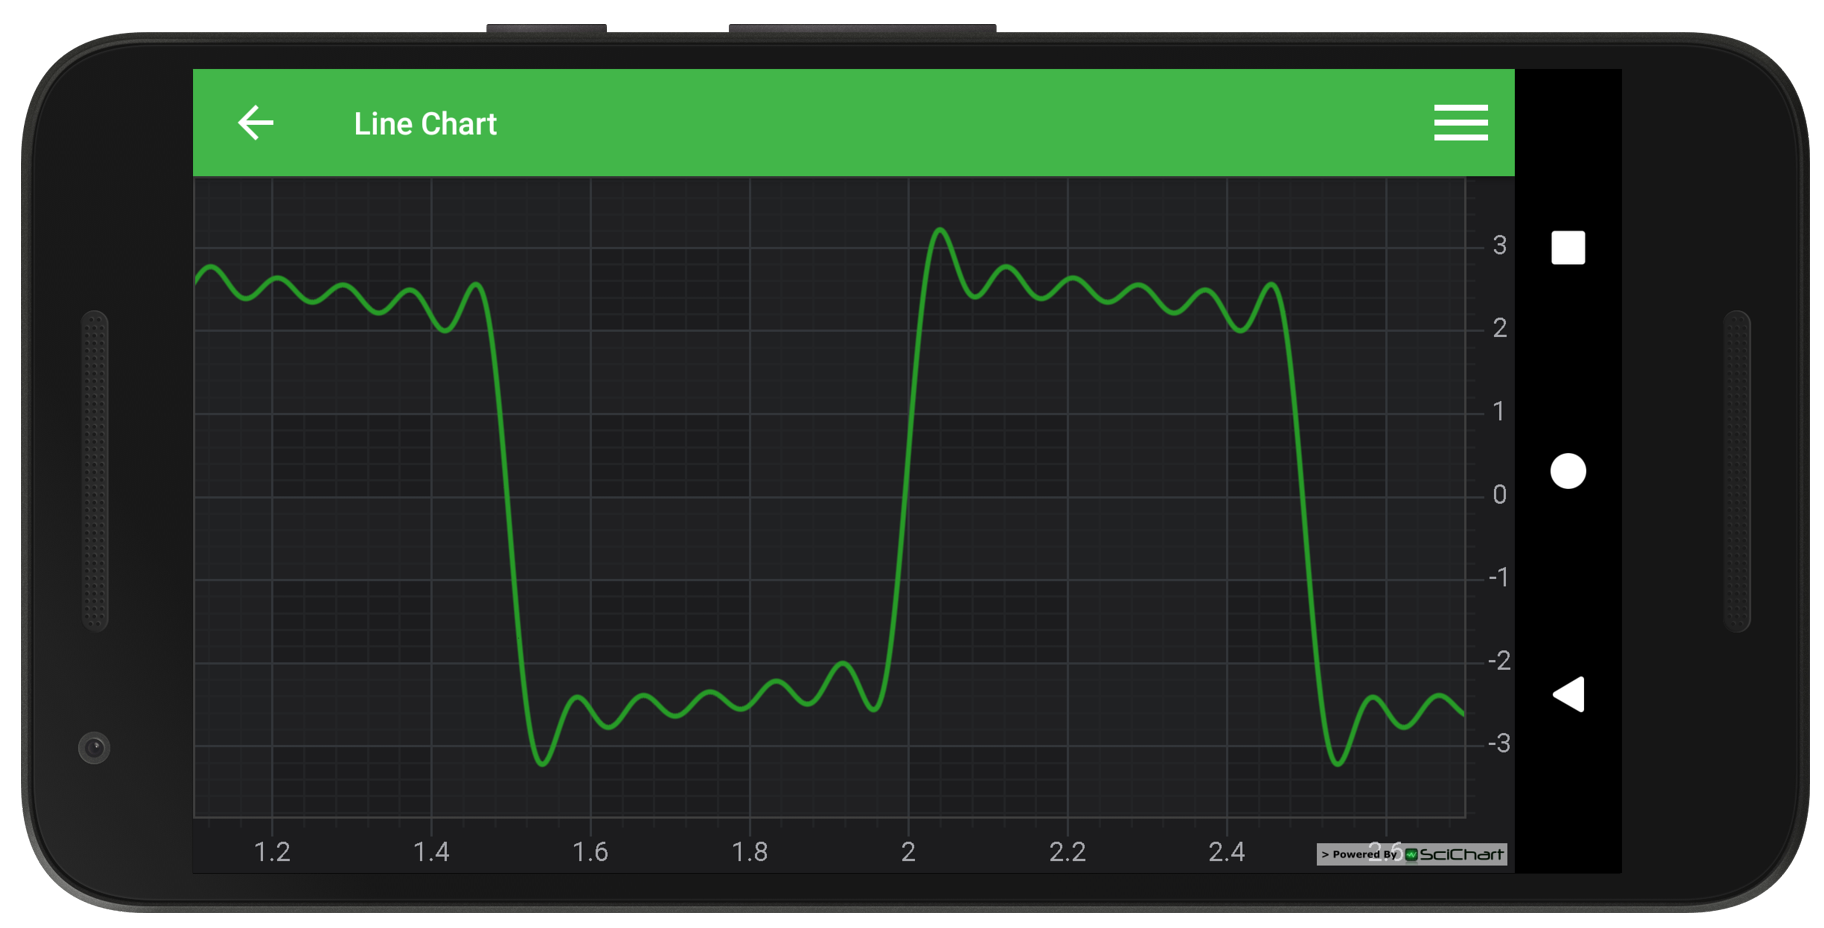
Line chart is one of the most commonly used charts on all platforms across many industries. This example demonstrates how to create an Android Line Chart in code. The FastLineRenderableSeries can be used to render XyDataSeries, XyyDataSeries (renders Y values), XyzDataSeries, HlcDataSeries and OhlcDataSeries(renders Close values) in Java.
SciChart Android supports millions of points out of the box, and is suitable for use in real-time scientific, medical and trading applications.
Tip!
You can be very flexible and change the Line appearance as follows:
– Changing its’ color and thickness with setStrokeStyle methods of FastLineRenderableSeries
– Make it dashed or digital line (step line) using the setIsVisible(), setIsDigitalLine() methods of FastLineRenderableSeries.
– Customize by adding either predefined or custom data-point markers on a line series using the PointMarker API.
Please note that custom data-point markers will be same very performant as the same bitmap rendering as in our Scatter-Charts is used.
The full source code for the Android Line Chart example is included below (Scroll down!).
Did you know you can also view the source code from one of the following sources as well?
//******************************************************************************
// SCICHART® Copyright SciChart Ltd. 2011-2021. All rights reserved.
//
// Web: http://www.scichart.com
// Support: support@scichart.com
// Sales: sales@scichart.com
//
// LineChartFragment.kt is part of SCICHART®, High Performance Scientific Charts
// For full terms and conditions of the license, see http://www.scichart.com/scichart-eula/
//
// This source code is protected by international copyright law. Unauthorized
// reproduction, reverse-engineering, or distribution of all or any portion of
// this source code is strictly prohibited.
//
// This source code contains confidential and proprietary trade secrets of
// SciChart Ltd., and should at no time be copied, transferred, sold,
// distributed or made available without express written permission.
//******************************************************************************
package com.scichart.examples.fragments.examples2d.basicChartTypes.kt
import android.view.animation.DecelerateInterpolator
import com.scichart.charting.visuals.SciChartSurface
import com.scichart.data.model.DoubleRange
import com.scichart.examples.data.DataManager
import com.scichart.examples.fragments.base.ExampleSingleChartBaseFragment
import com.scichart.examples.utils.scichartExtensions.*
class LineChartFragment : ExampleSingleChartBaseFragment() {
override fun initExample(surface: SciChartSurface) {
val fourierSeries = DataManager.getInstance().getFourierSeries(1.0, 0.1, 5000)
surface.suspendUpdates {
xAxes { numericAxis { visibleRange = DoubleRange(1.1, 2.7) } }
yAxes { numericAxis { growBy = DoubleRange(0.1, 0.1) } }
renderableSeries {
fastLineRenderableSeries {
dataSeries = XyDataSeries<Double, Double>().apply {
append(fourierSeries.xValues, fourierSeries.yValues)
}
strokeStyle = SolidPenStyle(0xFF279B27)
sweepAnimation { interpolator = DecelerateInterpolator() }
}
}
chartModifiers { defaultModifiers() }
}
}
}
//******************************************************************************
// SCICHART® Copyright SciChart Ltd. 2011-2021. All rights reserved.
//
// Web: http://www.scichart.com
// Support: support@scichart.com
// Sales: sales@scichart.com
//
// LineChartFragment.java is part of SCICHART®, High Performance Scientific Charts
// For full terms and conditions of the license, see http://www.scichart.com/scichart-eula/
//
// This source code is protected by international copyright law. Unauthorized
// reproduction, reverse-engineering, or distribution of all or any portion of
// this source code is strictly prohibited.
//
// This source code contains confidential and proprietary trade secrets of
// SciChart Ltd., and should at no time be copied, transferred, sold,
// distributed or made available without express written permission.
//******************************************************************************
package com.scichart.examples.fragments.examples2d.basicChartTypes;
import android.view.animation.DecelerateInterpolator;
import androidx.annotation.NonNull;
import com.scichart.charting.model.dataSeries.IXyDataSeries;
import com.scichart.charting.visuals.SciChartSurface;
import com.scichart.charting.visuals.axes.IAxis;
import com.scichart.charting.visuals.renderableSeries.FastLineRenderableSeries;
import com.scichart.core.framework.UpdateSuspender;
import com.scichart.examples.data.DataManager;
import com.scichart.examples.data.DoubleSeries;
import com.scichart.examples. fragments.base.ExampleSingleChartBaseFragment;
import java.util.Collections;
public class LineChartFragment extends ExampleSingleChartBaseFragment {
@Override
protected void initExample(@NonNull SciChartSurface surface) {
final IAxis xAxis = sciChartBuilder.newNumericAxis().withGrowBy(0.1d, 0.1d).withVisibleRange(1.1, 2.7).build();
final IAxis yAxis = sciChartBuilder.newNumericAxis().withGrowBy(0.1d, 0.1d).build();
final DoubleSeries fourierSeries = DataManager.getInstance().getFourierSeries(1.0, 0.1, 5000);
final IXyDataSeries<Double, Double> dataSeries = sciChartBuilder.newXyDataSeries(Double.class, Double.class).build();
dataSeries.append(fourierSeries.xValues, fourierSeries.yValues);
final FastLineRenderableSeries rSeries = sciChartBuilder.newLineSeries().withDataSeries(dataSeries).withStrokeStyle(0xFF279B27, 1f, true).build();
UpdateSuspender.using(surface, () -> {
Collections.addAll(surface.getXAxes(), xAxis);
Collections.addAll(surface.getYAxes(), yAxis);
Collections.addAll(surface.getRenderableSeries(), rSeries);
Collections.addAll(surface.getChartModifiers(), sciChartBuilder.newModifierGroupWithDefaultModifiers().build());
sciChartBuilder.newAnimator(rSeries).withSweepTransformation().withInterpolator(new DecelerateInterpolator()).withDuration(3000).withStartDelay(350).start();
});
}
}