SciChart® the market leader in Fast WPF Charts, WPF 3D Charts, iOS Chart, Android Chart and JavaScript Chart Components
SciChart Android ships with ~90Â Android Chart Examples which you can browse, play with, view the source-code and even export each SciChart Android Chart Example to a stand-alone Android Studio project. All of this is possible with the new and improved SciChart Android Examples Suite, which ships as part of our Android Charts SDK.
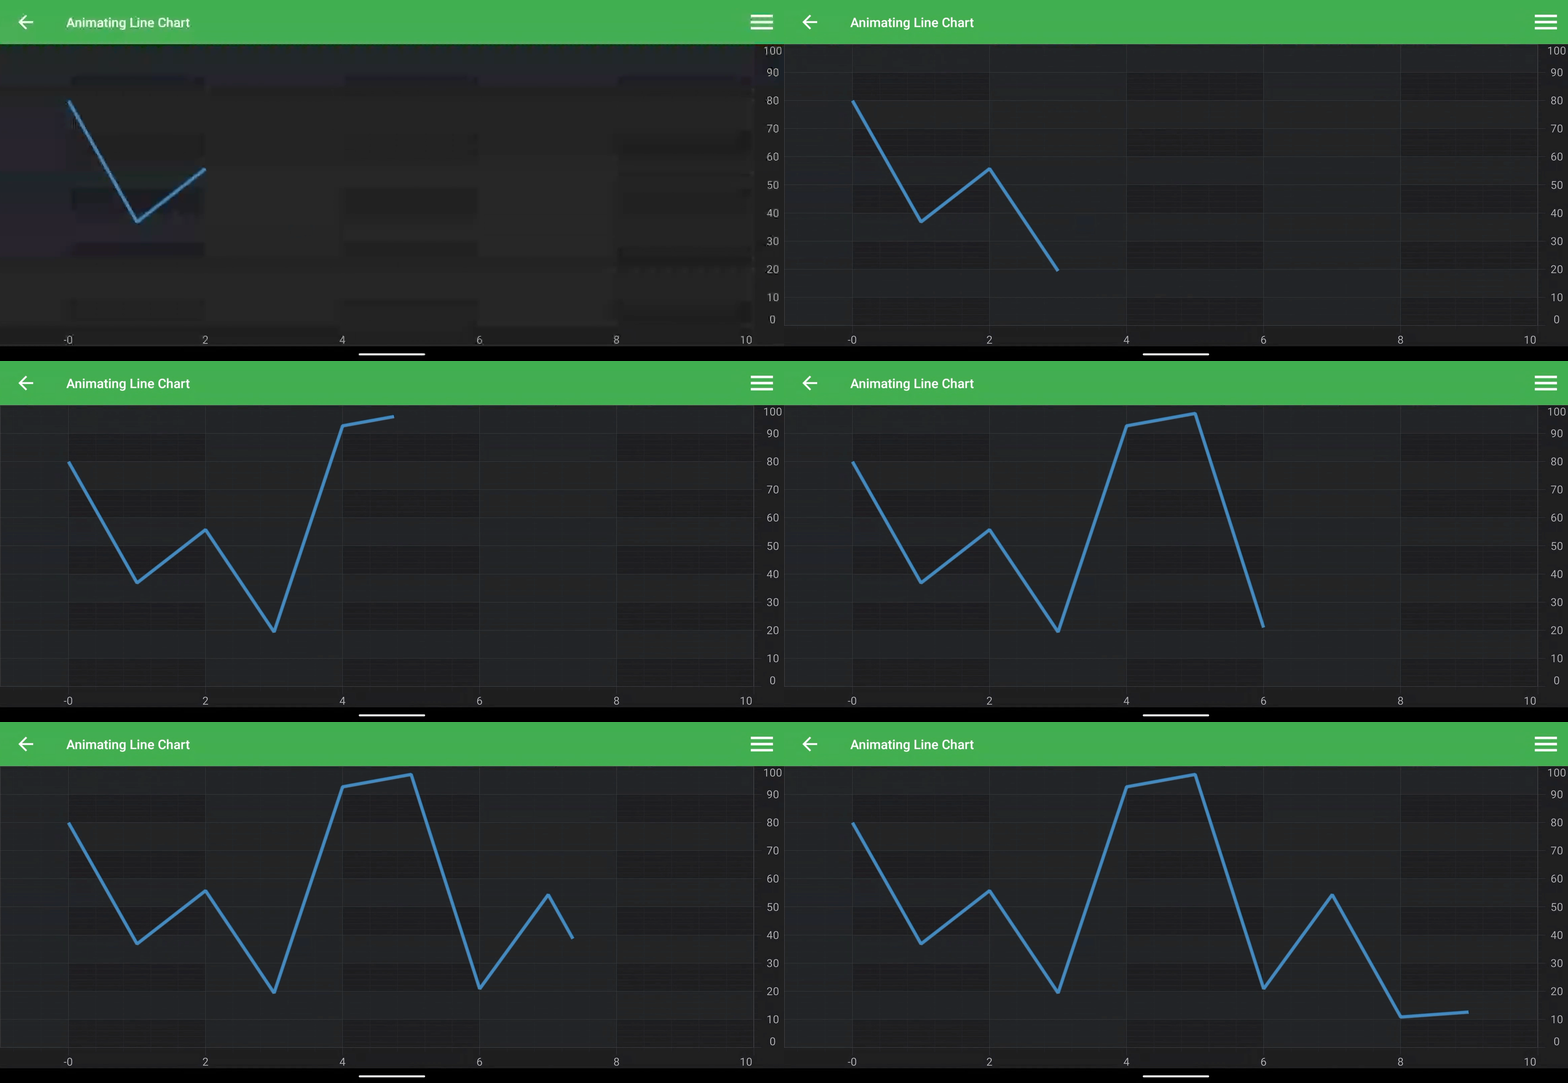
The Real-Time Animating Line example demonstrates how to create a custom chart series type. The AnimatingLineRenderableSeries class created in the example starts animating the last line segment as soon as a new data point arrives.
The chart uses FIFO DataSeries to make a chart scrolling. The VisibleRanges on X and Y axes adjust automatically after every update.
The full source code for the Android Real-Time Animating Line Chart example is included below (Scroll down!).
Did you know you can also view the source code from one of the following sources as well?
<?xml version="1.0" encoding="utf-8"?><!--*************************************************************************-->
<!-- SCICHART® Copyright SciChart Ltd. 2011-2016. All rights reserved. -->
<!-- -->
<!-- Web: http://www.scichart.com -->
<!-- Support: support@scichart.com -->
<!-- Sales: sales@scichart.com -->
<!-- -->
<!-- example_single_chart_fragment.xml is part of the SCICHART® Examples. Permission is hereby granted -->
<!-- to modify, create derivative works, distribute and publish any part of this source -->
<!-- code whether for commercial, private or personal use. -->
<!-- -->
<!-- The SCICHART® examples are distributed in the hope that they will be useful, but -->
<!-- without any warranty. It is provided "AS IS" without warranty of any kind, either -->
<!-- expressed or implied. -->
<!--*************************************************************************-->
<LinearLayout xmlns:android="http://schemas.android.com/apk/res/android"
android:layout_width="match_parent"
android:layout_height="match_parent"
android:orientation="vertical">
<com.scichart.charting.visuals.SciChartSurface
android:id="@+id/chart"
android:layout_width="fill_parent"
android:layout_height="fill_parent" />
</LinearLayout>
//******************************************************************************
// SCICHART® Copyright SciChart Ltd. 2011-2017. All rights reserved.
//
// Web: http://www.scichart.com
// Support: support@scichart.com
// Sales: sales@scichart.com
//
// AnimatingLineChartFragment.java is part of the SCICHART® Examples. Permission is hereby granted
// to modify, create derivative works, distribute and publish any part of this source
// code whether for commercial, private or personal use.
//
// The SCICHART® examples are distributed in the hope that they will be useful, but
// without any warranty. It is provided "AS IS" without warranty of any kind, either
// expressed or implied.
//******************************************************************************
package com.scichart.examples.fragments;
import android.animation.Animator;
import android.animation.ValueAnimator;
import android.os.Bundle;
import android.view.View;
import android.view.animation.DecelerateInterpolator;
import com.scichart.charting.model.dataSeries.IDataSeries;
import com.scichart.charting.model.dataSeries.IXyDataSeries;
import com.scichart.charting.model.dataSeries.IXyDataSeriesValues;
import com.scichart.charting.visuals.SciChartSurface;
import com.scichart.charting.visuals.axes.AutoRange;
import com.scichart.charting.visuals.axes.ICategoryDateAxis;
import com.scichart.charting.visuals.axes.NumericAxis;
import com.scichart.charting.visuals.renderableSeries.FastLineRenderableSeries;
import com.scichart.charting.visuals.renderableSeries.data.ISeriesRenderPassData;
import com.scichart.charting.visuals.renderableSeries.data.LineRenderPassData;
import com.scichart.charting.visuals.rendering.RenderPassState;
import com.scichart.core.framework.UpdateSuspender;
import com.scichart.core.model.DoubleValues;
import com.scichart.core.utility.Dispatcher;
import com.scichart.data.model.DoubleRange;
import com.scichart.data.model.ISciList;
import com.scichart.data.numerics.ResamplingMode;
import com.scichart.data.numerics.pointresamplers.IPointResamplerFactory;
import com.scichart.drawing.common.IAssetManager2D;
import com.scichart.drawing.utility.ColorUtil;
import com.scichart.examples.R;
import com.scichart.examples.fragments.base.ExampleBaseFragment;
import com.scichart.examples.utils.widgetgeneration.ImageViewWidget;
import com.scichart.examples.utils.widgetgeneration.Widget;
import java.util.ArrayList;
import java.util.Collections;
import java.util.List;
import java.util.Random;
import java.util.concurrent.Executors;
import java.util.concurrent.ScheduledExecutorService;
import java.util.concurrent.ScheduledFuture;
import java.util.concurrent.TimeUnit;
import butterknife.BindView;
public class AnimatingLineChartFragment extends ExampleBaseFragment {
private final static int FIFO_CAPACITY = 50;
private final static long TIME_INTERVAL = 1000;
private final static double ONE_OVER_TIME_INTERVAL = 1.0 / TIME_INTERVAL;
private final static double VISIBLE_RANGE_MAX = FIFO_CAPACITY * ONE_OVER_TIME_INTERVAL;
private final static double GROW_BY = VISIBLE_RANGE_MAX * 0.1;
private final Random random = new Random();
private final IXyDataSeries<Double, Double> ds1 = sciChartBuilder.newXyDataSeries(Double.class, Double.class).withFifoCapacity(FIFO_CAPACITY).build();
private final ScheduledExecutorService scheduledExecutorService = Executors.newSingleThreadScheduledExecutor();
private ScheduledFuture<?> schedule;
@BindView(R.id.chart)
SciChartSurface surface;
private volatile boolean isRunning = true;
private double t = 0;
private double yValue = 0;
private final DoubleRange xVisibleRange = new DoubleRange(-GROW_BY, VISIBLE_RANGE_MAX + GROW_BY);
@Override
protected void initExample() {
UpdateSuspender.using(surface, new Runnable() {
@Override
public void run() {
final NumericAxis xAxis = sciChartBuilder.newNumericAxis()
.withVisibleRange(xVisibleRange)
.withAutoRangeMode(AutoRange.Never)
.build();
final NumericAxis yAxis = sciChartBuilder.newNumericAxis()
.withGrowBy(new DoubleRange(0.1d, 0.1d))
.withAutoRangeMode(AutoRange.Always)
.build();
final AnimatingLineRenderableSeries rs1 = new AnimatingLineRenderableSeries();
rs1.setDataSeries(ds1);
rs1.setStrokeStyle(sciChartBuilder.newPen().withColor(ColorUtil.argb(0xFF, 0x40, 0x83, 0xB7)).withAntiAliasing(true).withThickness(3).build());
Collections.addAll(surface.getXAxes(), xAxis);
Collections.addAll(surface.getYAxes(), yAxis);
Collections.addAll(surface.getRenderableSeries(), rs1);
}
});
schedule = scheduledExecutorService.scheduleWithFixedDelay(new Runnable() {
@Override
public void run() {
if (!isRunning) {
return;
}
UpdateSuspender.using(surface, insertRunnable);
}
}, 0, TIME_INTERVAL, TimeUnit.MILLISECONDS);
}
private final Runnable insertRunnable = new Runnable() {
@Override
public void run() {
yValue += random.nextDouble() - 0.5;
ds1.append(t, yValue);
t += ONE_OVER_TIME_INTERVAL;
if(t > VISIBLE_RANGE_MAX)
xVisibleRange.setMinMax(xVisibleRange.getMin() + ONE_OVER_TIME_INTERVAL, xVisibleRange.getMax() + ONE_OVER_TIME_INTERVAL);
}
};
@Override
public void onSaveInstanceState(Bundle outState) {
super.onSaveInstanceState(outState);
isRunning = false;
outState.putDouble("time", t);
outState.putDouble("yValue", yValue);
outState.putDouble("xVisibleRangeMin", xVisibleRange.getMinAsDouble());
outState.putDouble("xVisibleRangeMax", xVisibleRange.getMaxAsDouble());
outState.putParcelable("xValues1", ds1.getXValues());
outState.putParcelable("yValues1", ds1.getYValues());
}
@Override
public void onActivityCreated(Bundle savedInstanceState) {
super.onActivityCreated(savedInstanceState);
if (savedInstanceState != null) {
t = savedInstanceState.getDouble("time");
yValue = savedInstanceState.getDouble("yValue");
final double xVisibleRangeMin = savedInstanceState.getDouble("xVisibleRangeMin");
final double xVisibleRangeMax = savedInstanceState.getDouble("xVisibleRangeMax");
xVisibleRange.setMinMaxDouble(xVisibleRangeMin, xVisibleRangeMax);
final ISciList<Double> xValues1 = savedInstanceState.getParcelable("xValues1");
final ISciList<Double> yValues1 = savedInstanceState.getParcelable("yValues1");
ds1.append(xValues1, yValues1);
}
}
@Override
public void onDestroyView() {
super.onDestroyView();
if (schedule != null)
schedule.cancel(true);
}
private void resetChart() {
UpdateSuspender.using(surface, new Runnable() {
@Override
public void run() {
ds1.clear();
}
});
}
private static class AnimatingLineRenderableSeries extends FastLineRenderableSeries implements Animator.AnimatorListener, ValueAnimator.AnimatorUpdateListener {
private static final float START_VALUE = 0f;
private static final float END_VALUE = 1f;
private double fromX, fromY, toX, toY;
private final ValueAnimator animator;
private volatile float animatedFraction;
private volatile boolean isUpdatesAllowed;
private AnimatingLineRenderableSeries() {
animator = ValueAnimator.ofFloat(START_VALUE, END_VALUE);
animator.setInterpolator(new DecelerateInterpolator());
animator.setDuration(TIME_INTERVAL);
animator.addUpdateListener(this);
animator.addListener(this);
}
@Override
protected void internalUpdateRenderPassData(ISeriesRenderPassData renderPassDataToUpdate, IDataSeries<?, ?> dataSeries, ResamplingMode resamplingMode, IPointResamplerFactory factory) throws Exception {
super.internalUpdateRenderPassData(renderPassDataToUpdate, dataSeries, resamplingMode, factory);
// can't animate series with less than 2 points
if(renderPassDataToUpdate.pointsCount() < 2 ) return;
final LineRenderPassData lineRenderPassData = (LineRenderPassData) renderPassDataToUpdate;
final DoubleValues xValues = lineRenderPassData.xValues;
final DoubleValues yValues = lineRenderPassData.yValues;
final int pointsCount = lineRenderPassData.pointsCount();
this.fromX = xValues.get(pointsCount - 2);
this.fromY = yValues.get(pointsCount - 2);
this.toX = xValues.get(pointsCount - 1);
this.toY = yValues.get(pointsCount - 1);
// need to replace last point to prevent jumping of line because
// animation runs from UI thread so there could be delay with animation start
// so chart may render original render pass data few times before animation starts
xValues.set(pointsCount - 1, fromX);
yValues.set(pointsCount - 1, fromY);
// do not update render pass data until animation starts
isUpdatesAllowed = false;
Dispatcher.postOnUiThread(new Runnable() {
@Override
public void run() {
if(animator.isRunning())
animator.cancel();
animator.start();
}
});
}
@Override
protected void internalUpdate(IAssetManager2D assetManager, RenderPassState renderPassState) {
super.internalUpdate(assetManager, renderPassState);
if(!isUpdatesAllowed) return;
final LineRenderPassData currentRenderPassData = (LineRenderPassData) getCurrentRenderPassData();
final double x = fromX + (toX - fromX) * animatedFraction;
final double y = interpolateLinear(x, fromX, fromY, toX, toY);
final int indexToSet = currentRenderPassData.pointsCount() - 1;
currentRenderPassData.xValues.set(indexToSet, x);
currentRenderPassData.yValues.set(indexToSet, y);
final float xCoord = currentRenderPassData.getXCoordinateCalculator().getCoordinate(x);
final float yCoord = currentRenderPassData.getYCoordinateCalculator().getCoordinate(y);
currentRenderPassData.xCoords.set(indexToSet, xCoord);
currentRenderPassData.yCoords.set(indexToSet, yCoord);
}
private static double interpolateLinear(double x, double x1, double y1, double x2, double y2) {
return y1 + (y2 - y1) * (x - x1) / (x2 - x1);
}
@Override
public void onAnimationStart(Animator animation) {
// allow updated of render pass data after animation starts
isUpdatesAllowed = true;
this.animatedFraction = START_VALUE;
invalidateElement();
}
@Override
public void onAnimationEnd(Animator animation) {
this.animatedFraction = END_VALUE;
invalidateElement();
}
@Override
public void onAnimationCancel(Animator animation) {
this.animatedFraction = START_VALUE;
invalidateElement();
}
@Override
public void onAnimationRepeat(Animator animation) {
}
@Override
public void onAnimationUpdate(ValueAnimator animation) {
this.animatedFraction = animation.getAnimatedFraction();
invalidateElement();
}
}
@Override
protected int getLayoutId() {
return R.layout.example_single_chart_fragment;
}
public boolean showDefaultModifiersInToolbar() {
return false;
}
@Override
public List<Widget> getToolbarItems() {
return new ArrayList<Widget>() {
{
add(new ImageViewWidget.Builder().setId(R.drawable.example_toolbar_play).setListener(new View.OnClickListener() {
@Override
public void onClick(View v) {
isRunning = true;
}
}).build());
add(new ImageViewWidget.Builder().setId(R.drawable.example_toolbar_pause).setListener(new View.OnClickListener() {
@Override
public void onClick(View v) {
isRunning = false;
}
}).build());
add(new ImageViewWidget.Builder().setId(R.drawable.example_toolbar_stop).setListener(new View.OnClickListener() {
@Override
public void onClick(View v) {
isRunning = false;
resetChart();
}
}).build());
}
};
}
}