SciChart® the market leader in Fast WPF Charts, WPF 3D Charts, iOS Chart, Android Chart and JavaScript Chart Components
SciChart Android ships with ~90Â Android Chart Examples which you can browse, play with, view the source-code and even export each SciChart Android Chart Example to a stand-alone Android Studio project. All of this is possible with the new and improved SciChart Android Examples Suite, which ships as part of our Android Charts SDK.
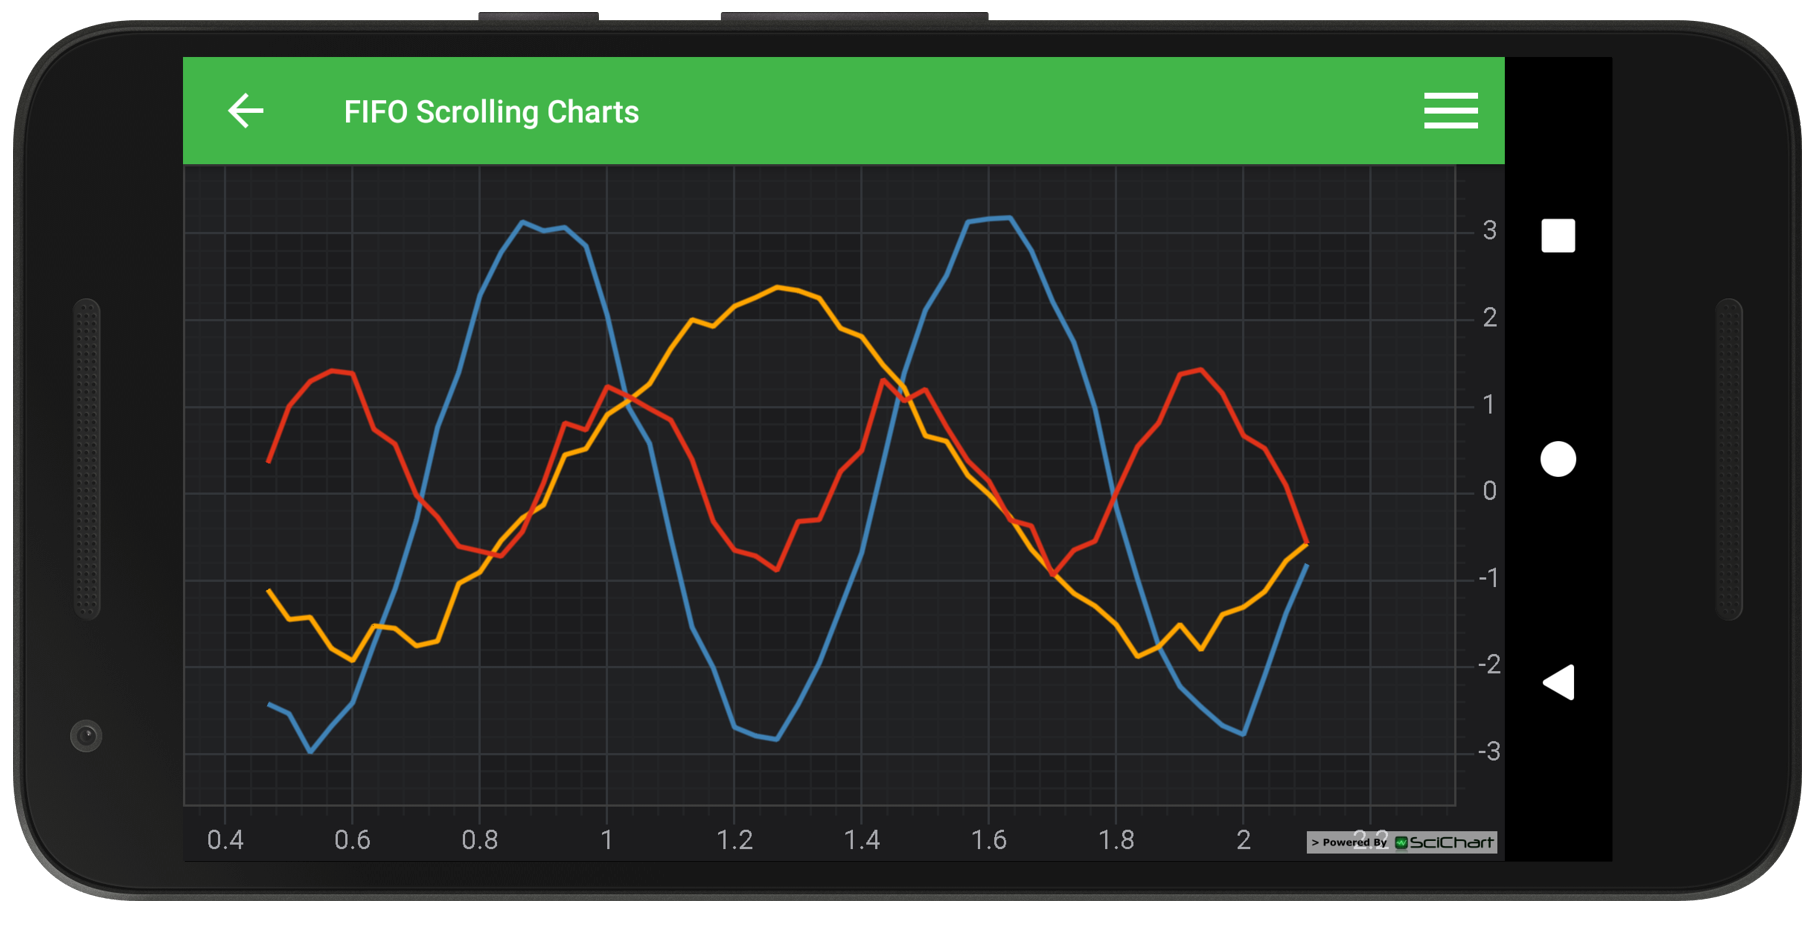
Demonstrates the difference between FIFO DataSeries and standard DataSeries. A FIFO series discards old data-points once a predefined number of points is met. This type of data-series is extremely efficient for scrolling charts, where you do not care about discarded (off-screen) data.
FIFO Series can be used in more ways than just scrolling a chart. For instance, reload the entire FIFO buffer each frame to get a Spectrum Analyzer style chart. Or, use FIFO series and call setVisibleRange() on X-Axis to achieve an ECG style chart.
Tip!
To switch to FIFO series just need to set FifoCapacity for DataSeries
The full source code for the Android Realtime Scrolling Charts example is included below (Scroll down!).
Did you know you can also view the source code from one of the following sources as well?
<!--*************************************************************************-->
<!-- SCICHART® Copyright SciChart Ltd. 2011-2017. All rights reserved. -->
<!-- -->
<!-- Web: http://www.scichart.com -->
<!-- Support: support@scichart.com -->
<!-- Sales: sales@scichart.com -->
<!-- -->
<!-- FIFO_Scrolling_Charts.xml is part of the SCICHART® Examples. Permission is hereby granted -->
<!-- to modify, create derivative works, distribute and publish any part of this source -->
<!-- code whether for commercial, private or personal use. -->
<!-- -->
<!-- The SCICHART® examples are distributed in the hope that they will be useful, but -->
<!-- without any warranty. It is provided "AS IS" without warranty of any kind, either -->
<!-- expressed or implied. -->
<!--*************************************************************************-->
<ExampleDefinition>
<IconPath>ic_realtime_feature</IconPath>
<Description>
Demonstrates the difference between FIFO and standard DataSeries. A FIFO series discards old data-points once a predefined number of points is met.
</Description>
<CodeFiles>
<string>res/layout/example_single_chart_fragment.xml.txt</string>
<string>java/com/scichart/examples/fragments/FifoChartsFragment.java.txt</string>
</CodeFiles>
<Features>
<Features>Realtime</Features>
<Features>Performance</Features>
<Features>FIFO</Features>
<Features>Scrolling</Features>
</Features>
<IsVisible>true</IsVisible>
</ExampleDefinition>
//******************************************************************************
// SCICHART® Copyright SciChart Ltd. 2011-2017. All rights reserved.
//
// Web: http://www.scichart.com
// Support: support@scichart.com
// Sales: sales@scichart.com
//
// FifoChartsFragment.java is part of the SCICHART® Examples. Permission is hereby granted
// to modify, create derivative works, distribute and publish any part of this source
// code whether for commercial, private or personal use.
//
// The SCICHART® examples are distributed in the hope that they will be useful, but
// without any warranty. It is provided "AS IS" without warranty of any kind, either
// expressed or implied.
//******************************************************************************
package com.scichart.examples.fragments;
import android.os.Bundle;
import android.view.View;
import com.scichart.charting.model.dataSeries.IXyDataSeries;
import com.scichart.charting.visuals.SciChartSurface;
import com.scichart.charting.visuals.axes.AutoRange;
import com.scichart.charting.visuals.axes.NumericAxis;
import com.scichart.charting.visuals.renderableSeries.IRenderableSeries;
import com.scichart.core.framework.UpdateSuspender;
import com.scichart.data.model.DoubleRange;
import com.scichart.data.model.ISciList;
import com.scichart.examples.R;
import com.scichart.examples.fragments.base.ExampleBaseFragment;
import com.scichart.examples.utils.widgetgeneration.ImageViewWidget;
import com.scichart.examples.utils.widgetgeneration.Widget;
import java.util.ArrayList;
import java.util.Collections;
import java.util.List;
import java.util.Random;
import java.util.concurrent.Executors;
import java.util.concurrent.ScheduledExecutorService;
import java.util.concurrent.ScheduledFuture;
import java.util.concurrent.TimeUnit;
import butterknife.BindView;
public class FifoChartsFragment extends ExampleBaseFragment {
private final static int FIFO_CAPACITY = 50;
private final static long TIME_INTERVAL = 30;
private final static double ONE_OVER_TIME_INTERVAL = 1.0 / TIME_INTERVAL;
private final static double VISIBLE_RANGE_MAX = FIFO_CAPACITY * ONE_OVER_TIME_INTERVAL;
private final static double GROW_BY = VISIBLE_RANGE_MAX * 0.1;
private Random random = new Random();
private final IXyDataSeries<Double, Double> ds1 = sciChartBuilder.newXyDataSeries(Double.class, Double.class).withFifoCapacity(FIFO_CAPACITY).build();
private final IXyDataSeries<Double, Double> ds2 = sciChartBuilder.newXyDataSeries(Double.class, Double.class).withFifoCapacity(FIFO_CAPACITY).build();
private final IXyDataSeries<Double, Double> ds3 = sciChartBuilder.newXyDataSeries(Double.class, Double.class).withFifoCapacity(FIFO_CAPACITY).build();
private final ScheduledExecutorService scheduledExecutorService = Executors.newSingleThreadScheduledExecutor();
private ScheduledFuture<?> schedule;
@BindView(R.id.chart)
SciChartSurface surface;
private final DoubleRange xVisibleRange = new DoubleRange(-GROW_BY, VISIBLE_RANGE_MAX + GROW_BY);
private volatile boolean isRunning = true;
@Override
public List<Widget> getToolbarItems() {
return new ArrayList<Widget>() {
{
add(new ImageViewWidget.Builder().setId(R.drawable.example_toolbar_play).setListener(new View.OnClickListener() {
@Override
public void onClick(View v) {
isRunning = true;
}
}).build());
add(new ImageViewWidget.Builder().setId(R.drawable.example_toolbar_pause).setListener(new View.OnClickListener() {
@Override
public void onClick(View v) {
isRunning = false;
}
}).build());
add(new ImageViewWidget.Builder().setId(R.drawable.example_toolbar_stop).setListener(new View.OnClickListener() {
@Override
public void onClick(View v) {
isRunning = false;
resetChart();
}
}).build());
}
};
}
@Override
protected int getLayoutId() {
return R.layout.example_single_chart_fragment;
}
@Override
protected void initExample() {
final NumericAxis xAxis = sciChartBuilder.newNumericAxis().withVisibleRange(xVisibleRange).withAutoRangeMode(AutoRange.Never).build();
final NumericAxis yAxis = sciChartBuilder.newNumericAxis().withGrowBy(0.1d, 0.1d).withAutoRangeMode(AutoRange.Always).build();
final IRenderableSeries rs1 = sciChartBuilder.newLineSeries().withDataSeries(ds1).withStrokeStyle(0xFF4083B7, 2f, true).build();
final IRenderableSeries rs2 = sciChartBuilder.newLineSeries().withDataSeries(ds2).withStrokeStyle(0xFFFFA500, 2f, true).build();
final IRenderableSeries rs3 = sciChartBuilder.newLineSeries().withDataSeries(ds3).withStrokeStyle(0xFFE13219, 2f, true).build();
UpdateSuspender.using(surface, new Runnable() {
@Override
public void run() {
Collections.addAll(surface.getXAxes(), xAxis);
Collections.addAll(surface.getYAxes(), yAxis);
Collections.addAll(surface.getRenderableSeries(), rs1, rs2, rs3);
}
});
schedule = scheduledExecutorService.scheduleWithFixedDelay(new Runnable() {
@Override
public void run() {
if (!isRunning) {
return;
}
UpdateSuspender.using(surface, insertRunnable);
}
}, 0, TIME_INTERVAL, TimeUnit.MILLISECONDS);
}
@Override
public void onSaveInstanceState(Bundle outState) {
super.onSaveInstanceState(outState);
isRunning = false;
outState.putDouble("time", t);
outState.putParcelable("xValues1", ds1.getXValues());
outState.putParcelable("yValues1", ds1.getYValues());
outState.putParcelable("xValues2", ds2.getXValues());
outState.putParcelable("yValues2", ds2.getYValues());
outState.putParcelable("xValues3", ds3.getXValues());
outState.putParcelable("yValues3", ds3.getYValues());
}
@Override
public void onActivityCreated(Bundle savedInstanceState) {
super.onActivityCreated(savedInstanceState);
if (savedInstanceState != null) {
t = savedInstanceState.getDouble("time");
final ISciList<Double> xValues1 = savedInstanceState.getParcelable("xValues1");
final ISciList<Double> yValues1 = savedInstanceState.getParcelable("yValues1");
final ISciList<Double> xValues2 = savedInstanceState.getParcelable("xValues2");
final ISciList<Double> yValues2 = savedInstanceState.getParcelable("yValues2");
final ISciList<Double> xValues3 = savedInstanceState.getParcelable("xValues3");
final ISciList<Double> yValues3 = savedInstanceState.getParcelable("yValues3");
ds1.append(xValues1, yValues1);
ds2.append(xValues2, yValues2);
ds3.append(xValues3, yValues3);
}
}
double t = 0;
private final Runnable insertRunnable = new Runnable() {
@Override
public void run() {
double y1 = 3.0 * Math.sin(((2 * Math.PI) * 1.4) * t) + random.nextDouble() * 0.5;
double y2 = 2.0 * Math.cos(((2 * Math.PI) * 0.8) * t) + random.nextDouble() * 0.5;
double y3 = 1.0 * Math.sin(((2 * Math.PI) * 2.2) * t) + random.nextDouble() * 0.5;
ds1.append(t, y1);
ds2.append(t, y2);
ds3.append(t, y3);
t += ONE_OVER_TIME_INTERVAL;
if (t > VISIBLE_RANGE_MAX) {
xVisibleRange.setMinMax(xVisibleRange.getMin() + ONE_OVER_TIME_INTERVAL, xVisibleRange.getMax() + ONE_OVER_TIME_INTERVAL);
}
}
};
@Override
public void onDestroyView() {
super.onDestroyView();
if (schedule != null) {
schedule.cancel(true);
}
}
private void resetChart() {
UpdateSuspender.using(surface, new Runnable() {
@Override
public void run() {
ds1.clear();
ds2.clear();
ds3.clear();
}
});
}
}