This question is related to this.
I still see a problem with memory accumulation and I just can’t cope with it. For clarity, I created a simple example with the simplest graph, two axes, one line series and 10,000 values in this graph.
When the page loads, no code is executed and there is only a button that creates one graph, adds it, waits 3 seconds and deletes it.
I use this button to test the speed and the fact of memory accumulation. For the simplest test, it is enough to simply create a certain number of times and wait for the graph to be deleted. After which it is clear that after some time the memory will not return to its previous values.
Example: after loading the page, memory consumption was about 30-40 MB, after creating and deleting 15 graphs (one by one), the memory was already 105 MB
Thus, with each graph, memory leaks.
Also, to test and search for memory leaks, I used the three snapshot technique:
1) created, for example, 2-3 graphics one by one
2) took a snapshot
3) created an even number of charts (for example, 10 or 25)
4) took a snapshot
5) created one or two more graphs
6) took a snapshot
7) I opened the 3rd Snapshot and looked at the result of the objects distributed between Snapshots 1 and 2. Every time I see the same exact values of 10 or 25 or multiples of them.
Can you please look at the code, at creation and deletion, repeat this test to understand where this memory is leaking from.
Thanks in advance for your answer. I hope the problem will be found.
Zip file upload has been forbidden.
Link to GoogleDrive: https://drive.google.com/file/d/177QFurYZwnnd5Hp9a9jQV2z4nt6ULhkX/view?usp=sharing
 Hi Yevhenii, thank you for providing a code sample. Our team ran this in the browser and hit ‘GC’ (Garbage Collect) in the chrome dev tools. Memory seems to be collected when the browser runs the GC. Can you try to do the same test on the code provided? Best regards, Andrew
 Update: actually you dont even have to hit GC to free the memory in your sample. Click ‘Create and Delete Chart’ then wait for the deletion. After take a snapshot in chrome dev tools. Can you reproduce the same? Here’s an animated gif showing what I did: http://www.scichart.com/wp-content/uploads/2023/12/memory-gc-scichart.gif
- You must login to post comments
Hi Yevhenni,
Thank you for providing the code sample.
I can’t see anything wrong in your code, you are doing all the right things: calling sciChartSurface.delete() when finished with the chart, and removing the <div> from the DOM. The only issue might be closure capture of sciChartSurface variable in the lambda functions.
Our team took a look at this and we were unable to reproduce a memory leak with your code.
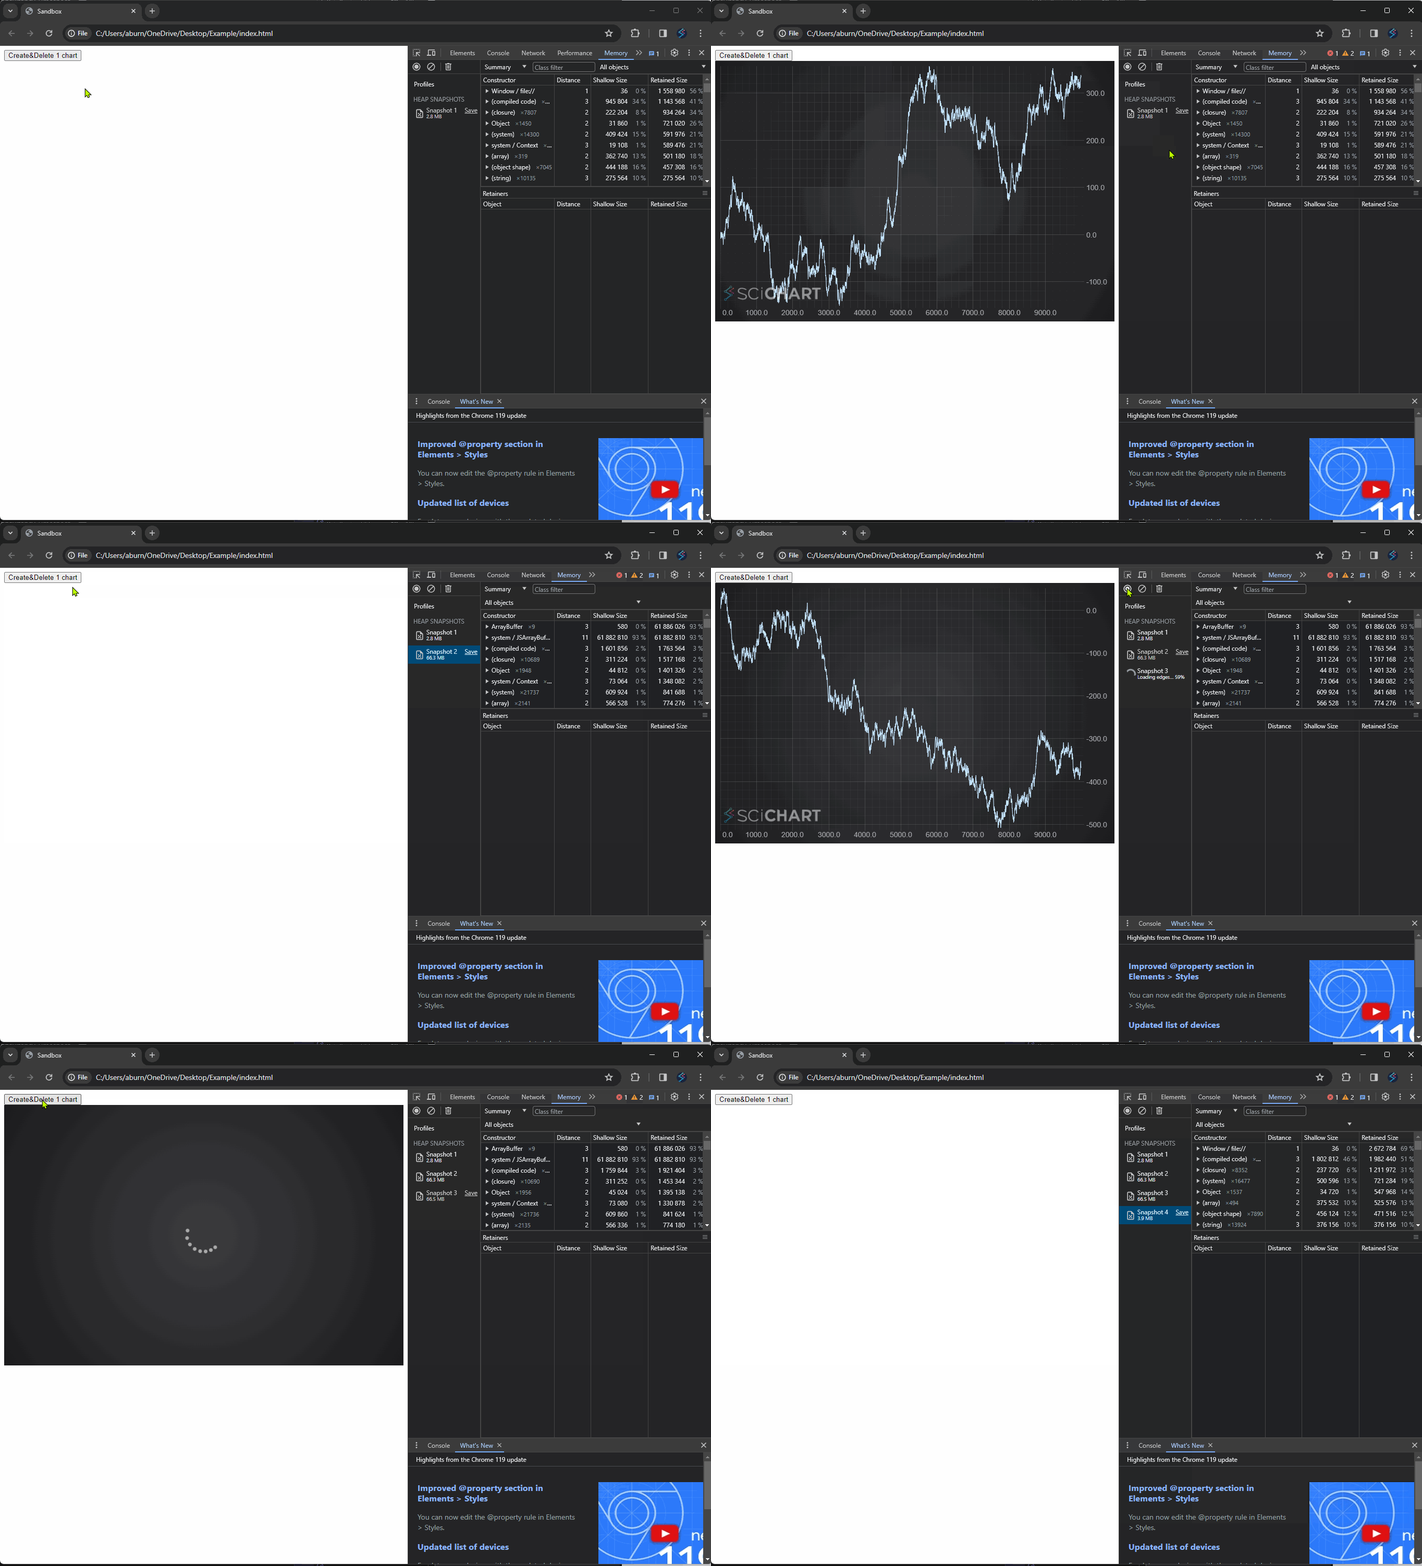
This is what we did:
- Open index.js inside google chrome
- Open dev tools and switch to memory profiler
- Press ‘Snapshot’ to capture memory before the test
- Hit ‘Create and delete chart’ and press ‘Snapshot’ before the chart deletes
- Repeat 2x
- On the third time hit ‘Create and delete chart’, wait for chart deletion, then press ‘Snapshot’
In the gif below you should see that the memory returns to around 3.9MB after chart deletion, so memory is being collected.

What’s happening on your machine?
Can you repeat my experiment exactly with the same code?
Best regards,
Andrew
- Andrew Burnett-Thompson answered 5 months ago
- You must login to post comments
Please login first to submit.
