Hi
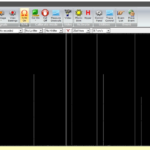
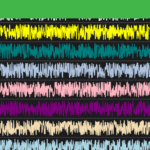
I have added 24 Line graphs for EEG. Now I want to display the name of each channels against each graph. I am using Y steeped graph which you are using for Vital signs display in example code. Can you please let me know how to t to display the name of each channels against each graph
Best Regards,
Aditya
- Aditya Kadambi asked 3 years ago
- You must login to post comments
Hi Aditya,
Well there are several possible ways to do this:
– You can set AxisTitle for YAxis in each EEG channel
– You can use Annotation API and place TextAnnotation with channel name inside each EEG chart
Is this suitable for your needs?
Best regards,
Yura
- Yura Khariton answered 3 years ago
- You must login to post comments
Hi Yura,
I tried both the options. But both did not work for me:
-
With the setAxis tile:
FontStyle titleStyle = new FontStyle(14, ColorUtil.Blue);
yAxisFp1Ref.setTitleStyle(titleStyle);
yAxisFp1Ref.setAxisTitle(“Fp1RefId”);
yAxisFp2Ref.setAxisTitle(“Fp2RefId”);
yAxisF3Ref.setAxisTitle(“F3RefId”); -
With annotation, I used the below code:
TextAnnotation textAnnotation = sciChartBuilder.newTextAnnotation()
.withText(“Fp1Ref”)
.withPosition(7.5d, 5d)
.withFontStyle(12, ColorUtil.Cyan)
.withVerticalAnchorPoint(VerticalAnchorPoint.Bottom)
.withXAxisId(“Top_X_Axis”)
.withYAxisId(“Left_Y_Axis”)
.withIsEditable(true)
.build();
Please help to add the channel names on the left y axis. Let me know the sample code available
Best regards,
Aditya
- Aditya Kadambi answered 3 years ago
- last edited 3 years ago
 Can you provide screenshot with desired output for chart, so I can use it as reference?
- You must login to post comments
Left Side Y axis we need to have channel numbers.
Please see the attached image of the graph. I just marked it with a red arrow
- Aditya Kadambi answered 3 years ago
- You must login to post comments
Hi there,
Well to achieve desired output setting AxisTitle should be enough. We have a hidden example in demo application that provides similar output, but from your screenshot it looks like more like you need something like this example ( based on screenshot where vertical lines on chart cross multiple Y axes, it looks like everything is rendered within single chart ), but with axis title for each Y axis.
Is this suitable for your needs?
Best regards,
Yura
- Yura Khariton answered 3 years ago
- last edited 3 years ago
- You must login to post comments
Please login first to submit.


