Hi Support Team.
I’m working on SciChart with React 16.9 . Licensed by EOG Resouces.
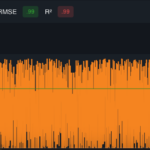
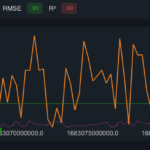
Can you guys please let me know how to custom tooltip/legend on SciChart (JS)?
My custom function is below. Thank all
export async function initSciChart(
  chartDiv: string,
  chartData: Array<{ x: Array<number>; y: Array<number> }>,
  handleMouseMove?: (args: ModifierMouseArgs) => void,
) {
  // Create the SciChartSurface in the div 'scichart-root'

  const theme = {
    ...new SciChartJSDarkv2Theme(),
    sciChartBackground: '#191F26',
  };

  const { sciChartSurface, wasmContext } = await SciChartSurface.create(
    chartDiv,
    { theme },
  );
  const legend = new LegendModifier({
    orientation: ELegendOrientation.Horizontal,
    // placementDivId: 'legend-div-id',
    showSeriesMarkers: true,
    showLegend: false,

    showCheckboxes: false,
    isCheckedChangedCallback: (series, isChecked) => {
      // isChecked callback only works if showCheckboxes=true
      console.log(
        `Option 1: Legend item ${series.type} isChecked=${isChecked}`,
      );
    },
  });

  sciChartSurface.chartModifiers.add(
    // new ZoomPanModifier(),
    new RolloverModifier({ placementDivId: 'legend-div-id' }), // enable tooltip
    new RubberBandXyZoomModifier(),
    new MouseWheelZoomModifier(),
    new ZoomExtentsModifier(),
    new XAxisDragModifier(),
    new YAxisDragModifier(),
    legend,
    new CursorModifier({
      //placementDivId: 'legend-div-id',
      //tooltipDataTemplate: customTemplate,
      //tooltipLegendTemplate: getTooltipLegendTemplate,
      // tooltipSvgTemplate: tooltipSvgTemplate,
    }), // enable cursor - yValue and xValue
  );

  sciChartSurface.xAxes.add(
    new NumericAxis(wasmContext, {
      drawMajorGridLines: false,
      drawMinorGridLines: false,
      drawMajorBands: false,
      visibleRangeLimit: new NumberRange(
        Math.min(...chartData[0].x),
        Math.max(...chartData[0].x),
      ),
    }),
  );
  sciChartSurface.yAxes.add(
    new NumericAxis(wasmContext, {
      drawMajorGridLines: false,
      drawMinorGridLines: false,
      drawMajorBands: false,

      zoomExtentsToInitialRange: false,
      autoRange: EAutoRange.Always,
    }),
  );

  chartData.forEach((seriesData, index) => {
    const lineSeries = new FastLineRenderableSeries(wasmContext, {
      stroke: AUTO_COLOR,

      strokeThickness: index % 2 === 0 ? 3 : 1,
      dataSeries: new XyDataSeries(wasmContext, {
        xValues: seriesData.x,
        yValues: seriesData.y,
        dataSeriesName: `series-${index}`,
      }),
    });

    lineSeries.rolloverModifierProps.tooltipLegendTemplate = (
      tooltipProps: RolloverModifierRenderableSeriesProps,
      seriesInfo: SeriesInfo,
    ) => {
      return `<svg width="340" height="25">
          <rect width="100%" height="100%" fill="#000000DD" stroke="grey" stroke-width="2" />
          <svg width="100%">
              <text x="8" y="16" font-size="13" font-family="Verdana" fill="red">Custom Legend Tooltip</text>
              <text x="180" y="16" font-size="13" font-family="Verdana" fill="lightblue">X: ${seriesInfo.formattedXValue}</text>
              <text x="260" y="16" font-size="13" font-family="Verdana" fill="green">Y: ${seriesInfo.formattedYValue}</text>
          </svg>
      </svg>`;
    };

    sciChartSurface.renderableSeries.add(lineSeries);

    //Custom event on chart
    if (sciChartSurface && handleMouseMove) {
      const customModifider = new FacilityBalanceChartModifier();
      sciChartSurface.chartModifiers.add(customModifider);
      customModifider.modifierMouseMove = handleMouseMove;
    }
  });
  return { sciChartSurface, wasmContext };
}
- TRUONG LE asked 11 months ago
- last edited 11 months ago
 Hi there, what is it exactly that you’re trying to do? I can see some images at the bottom of the question but it’s not clear what you want to achieve. Best regards, Andrew
- You must login to post comments
Hi
The way to customise the legend is to override legendModifier.sciChartLegend.getLegendItemHTML and legendModifier.sciChartLegend.getLegendHTML
The way it works by default is that within getLegendHTML, getLegendItemHTML is called for each element of the items collections. The default implementation for this is provided by the global getLegendItemHtml which looks like this
export const getLegendItemHtml = (
    orientation: ELegendOrientation,
    showCheckboxes: boolean,
    showSeriesMarkers: boolean,
    item: TLegendItem
): string => {
    const display = orientation === ELegendOrientation.Vertical ? "flex" : "inline-flex";
    let str = `<span class="scichart__legend-item" style="display: ${display}; align-items: center; margin-right: 4px; white-space: nowrap;">`;
    if (showCheckboxes) {
        const checked = item.checked ? "checked" : "";
        str += `<input ${checked} type="checkbox" id="${item.id}">`;
    }
    if (showSeriesMarkers) {
        if (item.gradient) {
            let gradientStr = "";
            item.gradient.gradientStops.forEach(s => {
                gradientStr += `,${s.color}`;
            });
            str += `<label for="${item.id}" style="background-image: linear-gradient(to right${gradientStr}); margin: 4px; width: 30px; height: 13px;"></label>`;
        } else {
            str += `<label for="${item.id}" style="background-color: ${item.color}; margin: 4px; width: 30px; height: 13px;"></label>`;
        }
    }
    str += `<label for="${item.id}" style="margin-left: 4px;">${item.name}</label>`;
    str += `</span>`;
    return str;
};
The resulting string is passed to the global getLegendContainerHtml function, which looks like this:
export const getLegendContainerHtml = (
    placement: ELegendPlacement,
    textColor: string,
    backgroundColor: string,
    margin: Thickness,
    body: string
): string => {
    if (!body) return "";

    const float = [ELegendPlacement.TopLeft, ELegendPlacement.BottomLeft].includes(placement) ? "left" : "right";
    let htmlStr = `<div class="scichart__legend" style="height: 100%; display: flex; float: ${float}; text-align: center;">`;

    const alignSelf = [ELegendPlacement.TopLeft, ELegendPlacement.TopRight].includes(placement)
        ? "flex-start"
        : "flex-end";
    const { left, right, bottom, top } = margin;
    const marginStyle = `margin-left: ${left}px; margin-top: ${top}px; margin-right: ${right}px; margin-bottom: ${bottom}px;`;
    htmlStr += `<div style="display: block; align-self: ${alignSelf}; width: fit-content; pointer-events: auto; ${marginStyle} padding: 5px; border-radius: 3px; background-color: ${backgroundColor}; color: ${textColor}">`;
    htmlStr += body;

    htmlStr += `</div></div>`;
    return htmlStr;
};
So if you just want to update the html for each series, override getLegendItemHTML. If you want to adjust the container as well, override getLegendHTML, and then you can either reuse the per item processing, or provide your own.
Regards
David
- David Burleigh answered 10 months ago
- You must login to post comments
Please login first to submit.


