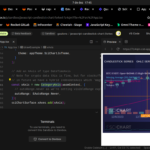
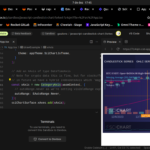
Hi, we are using CategoryAxis to display stock data, however, as you can see in the image below, within the “same” candle or volume, divergent information is displayed.
am I doing something wrong?
- rocket trade asked 7 months ago
 Hi. I don’t think you are doing anything wrong. I have reproduced this and will investigate today. David
- You must login to post comments
Thanks again for reporting this. I tracked it to a very low level bug in the CategoryCoordinateCalculator that only happens when zoomed in, and the chart is panned so there are not a whole number of points on the axis. This causes it to loose precision when going from coordinate to data, which leads to this odd behaviour on the hit test. It does not affect drawing.
The fix is pushed and will be released in the next day or so. I will update you when that happens.
Regards
David
- David Burleigh answered 7 months ago
 This is now released in v3.2.538. Changelog here https://www.scichart.com/changelog/scichart-js/
- You must login to post comments
Please login first to submit.


