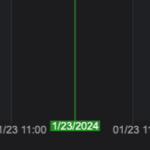
I am trying to change the format of CursorModifier
sciChartSurface.chartModifiers.add(
  new CursorModifier({
    modifierGroup: 'Chart',
    showAxisLabels: true,
    showTooltip: false,
    showYLine: false,
    showXLine: true,
  })
);
I have a custom DateLabelProvider for the xAxis that return dates in this format ‘MM/dd HH:mm’ but the CursorModifier tooltip is showing the ‘MM/dd/YYYY’ format, how can I change it?
- Jhonatan Laguna asked 6 months ago
- last edited 6 months ago
- You must login to post comments
Hi there,
There should be some examples for this in the docs. Two things you need to know:
- The Cursor and Tooltip Label format is controlled by the axis
- The axis has properties and functions for label formatting and cursor / tooltip label formatting
Take a look at the page titled Formatting CursorModifier Tooltips
Basic CursorModifier Tooltip Formatting Options
Tooltip and Axis Label formatting comes from the axis.labelprovider.formatCursorLabel() function and is axis-specific. You can read more about the Axis.LabelProvider API here, including how to specify formats from Enums and override formatting programmatically.Below we’re going to show you how to apply cursor formatting to enable four-decimal places on tooltips.
// Create a chart surface
  const { sciChartSurface, wasmContext } = await SciChartSurface.create(divElementId, {
    theme: new SciChartJsNavyTheme(),
    titleStyle: { fontSize: 16 }
  });

  sciChartSurface.xAxes.add(new NumericAxis(wasmContext, {
    // label format options applied to the X-Axis
    labelPrecision: 2,
    labelFormat: ENumericFormat.Decimal,
    // label format options applied to cursors & tooltips
    cursorLabelPrecision: 4,
    cursorLabelFormat: ENumericFormat.Decimal
  }));
  sciChartSurface.yAxes.add(new NumericAxis(wasmContext, {
    // label format options applied to the X-Axis
    labelPrecision: 1,
    labelFormat: ENumericFormat.Decimal,
    // label format options applied to cursors & tooltips
    cursorLabelPrecision: 4,
    cursorLabelFormat: ENumericFormat.Decimal
  }));

  // Add a CursorModifier to the chart
  const cursorModifier = new CursorModifier({
    showTooltip: true,
    showAxisLabels: true,
    hitTestRadius: 10,
  });
  sciChartSurface.chartModifiers.add(cursorModifier);
There’s a codepen in the Formatting CursorModifier Tooltips documentation page which you can modify & extend for date formatting.
For your specific example, if you already have a DateLabelProvider for the xAxis then you probably just need to override both formatLabel and formatCursorLabel.
There’s some further information and reading in the Axis documentation.
For example:
- The DateTimeNumericAxis docs show the properties which affect label and cursor formatting
- The CustomLabelProvider documentation page shows how to create a custom labelprovider which outputs axis and cursor (tooltip) labels
hope this helps!
Best regards,
Andrew
- Andrew Burnett-Thompson answered 6 months ago
- You must login to post comments
Please login first to submit.

