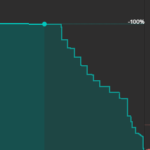
Good afternoon. My team and I are looking at your library to create a depth chart, like here, but have run into a few problems:
1. if we have, for example, a “buySeries” array larger than the “sellSeries” array, the graph is not drawn very nicely.
2. the labels are not drawn correctly when we have too small numbers, I tried to solve the problem with xAxis.textFormatting = ‘0.#####’ or ‘0.00###’, but that doesn’t work for some reason.
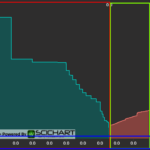
3. If we want to add labels while hovering over the chart with showLabel = true , then we get 4 labels, two on yAxis. is it possible to make the buySeries label appear only on the left, for example, and the sellSeries label only on the right? (second screenshot)
- Andrew Smidth asked 2 years ago
- You must login to post comments
Hi Andrew
David our CTO who made the Javascript Market Depth example is on vacation at the moment. I can say that
(1) – we will look into this. Probably something to do with spacing out the two mountain series correctly.
(2) text label formatting is controlled using this method. If you check the methodologies there you should be able to set number of decimal places.
For example:
    // Set Label Formatting properties in the axis constructor
    sciChartSurface.yAxes.add(new NumericAxis(wasmContext, {
        visibleRange: new NumberRange(0, 1),
        labelFormat: ENumericFormat.Decimal,
        labelPrecision: 4,
        cursorLabelFormat: ENumericFormat.Decimal,
        cursorLabelPrecision: 4,
    }));
(3) All the labels are set in the DepthCursorModifier.ts file – a custom modifier for handling cursors, overlays and annotations (text) on the chart. Rather than a native feature in SciChart.js we’ve shown you how you can use our ChartModifier API to create complex interactions with cursors and labels.
What I suggest doing for (3) is having a look through that code and seeing how we place the labels in the update(), updateBuy() and updateSell() functions. Can you modify it to meet your needs? If specific questions then please post an image of what you want and I can get an answer when David is back.
Best regards
Andrew
- Andrew Burnett-Thompson answered 2 years ago
- You must login to post comments
Hi
The DepthCursorModifier isn’t an official feature – more a demonstration of how you can manage multiple annotations within a modifier. That said, it looks like you’ve created a second y axis, which could be messing with the placement of the labels for the line annotations. Or have you added an additional cursorModifier? With multiple axes you usually need to set the axisId on the modifier and/or annotation so it can place itself relative to the correct axis.
If the standard line labels are not doing what you want, the other option is to turn them off and use AxisMarkerAnnotation instead.
If you want to always have the mid price in the middle, then you can manually set the visible range of the x axis, though this will leave a gap on the side with less data. You could potentially used stacked X Axis to put each side on its own axis so they can have different scales.
I don’t know what the “correct” behaviour is if the buy and sell do not have equivalent points – ie what should it do if you hover over a point 10 units away from mid on the buy side, but there is no point 10 units away on the sell side? In our example it returns the nearest point to that 10 unit position, but you might want it to not show a sell side annotation at all, or to interpolate, or to always pick the point closest to mid. All these are possible with SciChart – have a dig into the data in the hitTestInfo.
If you would like us to take a look at your code, please open a support ticket.
Regards
David
- David Burleigh answered 2 years ago
- You must login to post comments
Please login first to submit.


