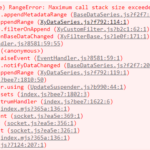
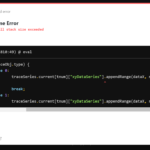
I have a live updating chart with multiple traces. After updated SciChart to v3.0.280, I got “Uncaught (in promise) RangeError: Maximum call stack size exceeded” error sometimes when I call XyDataSeries.appendRange(). This error will not be triggered if just initialize the chart and keeps updating the chart data. It seems happening after I modified the visibleRange of x-axis or y-axis. But the error is triggered on the line calling appendRange(). I have no clue for this issue. My codes didn’t change and only updated the SciChart version. Could you find the possible cause of my problem? Please refer to the attached screenshots.
Codes to update the chart data:
    UpdateSuspender.using(sciChartSurfaceRef.current, () => {
        console.time("Time - Update series");
        for (tnum=0; tnum<MAX_TRACE; tnum++) {
            traceObj = tracesInfoObj.current[tnum];
            if (traceSeries.current[tnum] && traceObj.status === "Active") {
                traceSeries.current[tnum]["xyDataSeries"].clear();
                switch (traceObj.type) {
                    case 0:
                        traceSeries.current[tnum]["xyDataSeries"].appendRange(dataX, newSpecData);
                        break;
                    case 1:
                        traceSeries.current[tnum]["xyDataSeries"].appendRange(dataX, newMaxHoldData);
                        break;
                    case 2:
                        traceSeries.current[tnum]["xyDataSeries"].appendRange(dataX, newMinHoldData);
                        break;
                    case 3:
                        traceSeries.current[tnum]["xyDataSeries"].appendRange(dataX, averageData);
                        break;
                }
            }
        };
        console.timeEnd("Time - Update series");
    });
- Quyen Sy asked 1 year ago
- last edited 1 year ago
 If you look at the call stack. The error is occurring after updating a filter. I remember from a previous question you’d setup a filter incorrectly. Is it possible you have a DataSeries A filtered by B which is then filtered by C (or something similar?) I suggest looking at your code how you’ve setup filters and if you can providing more info. If there is a bug try to isolate it in a codepen and our engineers can investigate
- You must login to post comments
Hi Andrew, below are the codes for drawing the chart, adding trace and updating data series.
Drawing the chart:
const drawSpecChart = useCallback(async () => {
    const { sciChartSurface, wasmContext } = await SciChartSurface.create("scichart-root");
    const xAxesNumberRange = new NumberRange(specSettingsRef.current.start/freqUnits.KHZ, specSettingsRef.current.stop/freqUnits.KHZ);
    const yAxesNumberRange = new NumberRange(specSettingsRef.current.refLevel - DEFAULT_SPEC.Y_RANGE, specSettingsRef.current.refLevel);

    sciChartSurface.xAxes.add(new NumericAxis(wasmContext, {
        axisTitle: "Frequency (GHz)",
        axisTitleStyle: {
            fontSize: CHART_STYLE.AXIS_FONT_SIZE,
            fontFamily: "sans-serif",
            fontWeight: "bold"
        },
        labelStyle: {
            fontSize: CHART_STYLE.LABEL_FONT_SIZE,
            fontFamily: "sans-serif"
        },
        visibleRange: xAxesNumberRange,
        zoomExtentsRange: xAxesNumberRange,
        labelFormat: ENumericFormat.Decimal,
        labelPrecision: 6,
        cursorLabelFormat: ENumericFormat.Decimal,
        cursorLabelPrecision: 6,
        drawMajorBands: false,
    }));

    sciChartSurface.yAxes.add(new NumericAxis(wasmContext, {
        axisTitle: "Power (dBm)",
        axisTitleStyle: {
            fontSize: CHART_STYLE.AXIS_FONT_SIZE,
            fontFamily: "sans-serif",
            fontWeight: "bold"
        },
        labelStyle: {
            fontSize: CHART_STYLE.LABEL_FONT_SIZE,
            fontFamily: "sans-serif"
        },
        autoTicks: false,
        majorDelta: specSettingsRef.current.scale,
        minorDelta: 5,
        axisAlignment: EAxisAlignment.Left,
        visibleRange: yAxesNumberRange,
        zoomExtentsRange: yAxesNumberRange,
        labelFormat: ENumericFormat.Decimal,
        labelPrecision: 2,
        cursorLabelFormat: ENumericFormat.Decimal,
        cursorLabelPrecision: 2,
        drawMajorBands: false,
    }));

    sciChartSurface.chartModifiers.add(new ZoomPanModifier({ isAnimated: false }));
    sciChartSurface.chartModifiers.add(new ZoomExtentsModifier({ isAnimated: false }));
    sciChartSurface.chartModifiers.add(new MouseWheelZoomModifier());

    sciChartSurfaceRef.current = sciChartSurface;
    wasmContextRef.current = wasmContext;
    changeSpecChartTheme(themeRef.current);

    xAxesNumberRange = null;
    yAxesNumberRange = null;
}, [freqUnits.KHZ, changeSpecChartTheme]);
Adding trace:
const addTrace = useCallback((traceType, traceNum, color) => {
    traceSeries.current[traceNum] = {};
    traceSeries.current[traceNum]["xyDataSeries"] = new XyDataSeries(wasmContextRef.current);
    traceSeries.current[traceNum]["offsetFilter"] = new XyScaleOffsetFilter(traceSeries.current[traceNum]["xyDataSeries"], { scale: 1, offset: specSettingsRef.current.refOffset });
    traceSeries.current[traceNum]["series"] = new FastLineRenderableSeries(wasmContextRef.current, {
        id: traceNum,
        stroke: color ? color : tracesInfoObj.current[traceNum].color,
        strokeThickness: 1,
        dataIsSortedInX: true,
        dataEvenlySpacedInX: true,
        containsNaN: false,
        dataSeries: traceSeries.current[traceNum]["offsetFilter"],
    });
    sciChartSurfaceRef.current.renderableSeries.add(traceSeries.current[traceNum]["series"]);
}, []);
Updating data series:
UpdateSuspender.using(sciChartSurfaceRef.current, () => {
    console.time("Time - Update series");
    for (tnum=0; tnum<MAX_TRACE; tnum++) {
        traceObj = tracesInfoObj.current[tnum];
        if (traceSeries.current[tnum] && traceObj.status === "Active") {
            traceSeries.current[tnum]["xyDataSeries"].clear();
            switch (traceObj.type) {
                case 0:
                    traceSeries.current[tnum]["xyDataSeries"].appendRange(dataX, newSpecData);
                    break;
                case 1:
                    traceSeries.current[tnum]["xyDataSeries"].appendRange(dataX, newMaxHoldData);
                    break;
                case 2:
                    traceSeries.current[tnum]["xyDataSeries"].appendRange(dataX, newMinHoldData);
                    break;
                case 3:
                    traceSeries.current[tnum]["xyDataSeries"].appendRange(dataX, averageData);
                    break;
            }
        }
    };
    console.timeEnd("Time - Update series");
});
- Quyen Sy answered 1 year ago
 Can you put this together in a codepen or codesandbox? I just blogged how to do this here: https://www.scichart.com/blog/codepen-codesandbox-and-jsfiddle-support-in-scichart-js/ — I suspect something in the way you’ve setup the filters is causing infinite recursion and the StackOverflow exception
 I tried to create an example in codepen: https://codepen.io/fairest36/pen/qBygrZm .But I can’t trigger the error in this example. I also think that it should be related to the offsetFilter as the error gone if I don’t use offsetFilter in my codes. Also, it’s more easy to trigger the issue if the data size is large (e.g. > 150,000). I tried to test large data size in my example. But I find that when the data size is equal to or larger than 125,000, nothing can be plotted in the chart. Do you know the reason of this issue?
 It sounds to me like a StackOverflow exception occurring because of filters, but in normal operation this shouldn’t happen.
 I was able to see the error in the codepen provided, will investigate. Thanks!
- You must login to post comments
Hello, we have published a fix for the issue. Please try out the latest library version (^3.0.300) and let us know if it works for you.
- Jim Risen answered 1 year ago
 Thank you!
- You must login to post comments
Please login first to submit.


