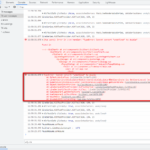
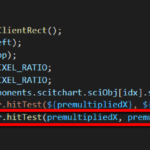
I encountered an exception inside scichart2d.js when I used hitTestProvider.hitTest.
getHitTestInfo(idx, e) {
let touch0 = e.targetTouches[0];
let rect = e.currentTarget.getBoundingClientRect();
let x = parseInt(touch0.pageX - rect.left);
let y = parseInt(touch0.pageY - rect.top);
const premultipliedX = x * DpiHelper.PIXEL_RATIO;
const premultipliedY = y * DpiHelper.PIXEL_RATIO;
let lineSeries = this.$store.state.components.scitchart.sciObj[idx].sciChartSurface.renderableSeries.items[0];
console.log(`lineSeries.hitTestProvider.hitTest(${premultipliedX}, ${premultipliedY}, ${DpiHelper.PIXEL_RATIO})`);
let result = lineSeries.hitTestProvider.hitTest(premultipliedX, premultipliedY, DpiHelper.PIXEL_RATIO);
return result;
}
The video URL is as follows
https://youtu.be/3GIlv_ldorY
- chinghung lai asked 2 years ago
- last edited 2 years ago
 Hi Chinghung, I wonder if you are using CategoryAxis or NumericAxis? If it is CategoryAxis, does it break if you change it to NumericAxis? Please provide a full code to reproduce the problem locally. We created this task to investigate https://abtsoftware.myjetbrains.com/youtrack/issue/SCJS-981 Best regards, Michael.
 Hi Michael, This error will only occur in CategoryAxis and not in NumericAxis. Here is the full code to reproduce the problem locally. https://drive.google.com/file/d/1xuGeJsCtV1J10lU7kbH4XT9y0mgHF1Ig/view?usp=sharing
 reproduce the problem locally video : https://youtu.be/_2Kn7p2S_xI
- You must login to post comments
Hi Chinghung. Thank you for sharing this example. We’ve investigated the issue and found the cause of the problem.
The xValues and yValues must be (number[] or Float64Array)
You need to replace xValues, yValues with the correct type:
const xValues = Array.from({length: 100}, (x,i) => i); (for your case, from provided example)
If you want to custom axis labels, please, use the LabelProvider:
- Vladyslav Bykov answered 2 years ago
- You must login to post comments
Please login first to submit.


