I am using the solution you provided on, https://www.scichart.com/questions/js/is-it-possible-to-create-info-box-that-will-sync-with-the-xaxis-of-the-chart.
The solution work great but there is one issue, the issue is that the text annotation should always be visible.
The issue with this solution is that the text annotation disappear if I zoom in somewhere not the text area.
Also another issue is that, in this example, the first info box x1 is beyond the current range, and so the text annotation is not visible, since the x1 of the text annotation is the same as info box and x1 is not within the current range.
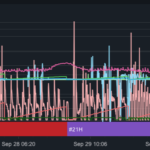
First image show the first red info box x1 is not within current range, therefore not showing text annotation and the second info box working as expected with text annotation.
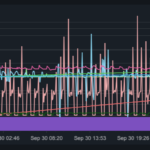
The second image show what happen once I zoom in on the right side away from the text annotation, then the ‘#21H’ is not visible anymore, which is wrong. Just like in my previous question example, the text annotation should always be visible, other than that, everything work great.
Thank you and let me know if there is any question.
- Nung Khual asked 7 months ago
- last edited 7 months ago
 Hi Nung, I’ve read your question and understand you’re referring to the codesandbox in my previous answer here https://codesandbox.io/s/vertically-stacked-axes-forked-m6tcs4. Could you help us understand the problem a little more clearly though? A video and updated codesandbox would be helpful. Best regards, Andrew
 I have updated the codesanbox, https://codesandbox.io/s/vertically-stacked-axes-forked-3xp6gq?file=/src/App.tsx The issue is that when zoomed, the text annotation disappear, I need the text annotation to be visible, if the info box is still within the zoom range. I need the text annotation to be visible if the info box is within the initial range and if zoom, then if it is within zoomed range, then it should be visible.
- You must login to post comments
Hi
Here is an updated codesandbox with some code to manage the text positions. https://codesandbox.io/s/keep-text-with-box-or-chart-mhj5g5
For each box and text pair, we do this:
// Synchronise the positions in prerender so that the change affect the current frame and do not trigger another redraw
sciChartSurface.preRender.subscribe((data) => {
  const xAxis = sciChartSurface.xAxes.get(0);
  // Annotation borders give you the size in pixels.
  const { x1: tx1, x2: tx2 } = textAnn.getAnnotationBorders(true, false);
  const width = tx2 - tx1;
  // Convert to data space, since that is how the annotations are placed
  const dataWidth = xAxis.getCurrentCoordinateCalculator().getDataValue(width);
  // Hide the text if there is not space for it in the remaining size of the box
  textAnn.isHidden = boxAnn.x2 < dataWidth;
  // Keep the text on the chart if the left of the box is off it.
  textAnn.x1 = Math.max(boxAnn.x1, xAxis.visibleRange.min);
});
The key bit is the last line. The rest is handling the case where the box is nearly off the chart and there is not enough space to fit the label. It’s worth being aware of getAnnotationBorders as a way of finding the actual size of an annotation (in pixels)
Regards
David
- David Burleigh answered 7 months ago
- You must login to post comments
Hi Nung
I had a similar requirement, but my annotations were at the top of the graph.
So I used a Grid with two rows. And fixed the top row of the Grid to a fixed size.
In both rows I added a SciChartSurface with both having the same value for SciChartGroup.VerticalChartGroup
On the row with annotations I set both X and Y axes visibility to Collapsed and settings as:
  <s:SciChartSurface.XAxis>
            <s:NumericAxis Visibility="Collapsed"  DrawMajorBands="False" DrawMinorGridLines="False" DrawMajorGridLines="False" VisibleRange="{Binding Source={x:Reference Name=primaryXAxis}, Path=VisibleRange, Mode=TwoWay}" ></s:NumericAxis>
        </s:SciChartSurface.XAxis>
        <s:SciChartSurface.YAxes  >
            <s:NumericAxis Visibility="Collapsed" DrawMajorBands="False" DrawMinorGridLines="False" DrawMajorGridLines="False" DrawMajorTicks="False" DrawMinorTicks="False" AxisAlignment="Left" AutoRange="Never" VisibleRange="0,1" ></s:NumericAxis>
        </s:SciChartSurface.YAxes>
Then when the main chart was zoomed, the X-axis of the annotation chart followed it.
I then added my annotation labels/boxes to the annotation chart, setting the CoordinateMode to RelativeY and the Y1,Y2 to 0,1 and the X1,X2 to the span I wanted to cover on Xaxis.
Result is attached.
I am sure you could adapt this idea to move the annotations to the bottom.
The annotations are always visible even if zoom main graph in X or Y.
- Andrew Milford answered 7 months ago
 Sorry, should have mentioned this was on wpf, I don’t know if same will work on js
 It’s similar, and thanks for replying anyway!
- You must login to post comments
Please login first to submit.


