Scenario: user selects an area of a heatmap chart using a box annotation via a mouse drag.
I have created a custom modifier to draw the box annotation. I’ve used this as the basis: SimpleDataPointSelectionModifier.ts
My question is: how to I get the X axis start + end values and the Y axis start + end values based on the area of the annotation/mouse coordinates.
Thanks
- Henrique Rodrigues asked 3 years ago
- last edited 3 years ago
- You must login to post comments
Hi Henrique,
That should be pretty easy, and we do something similar to that already in SimpleDataPointSelectionModifier.ts.
const { xCalc, yCalc } = this.getDefaultCoordCalculators();
if (!xCalc) {
    return;
}
this.selectionAnnotation.x2 = xCalc.getDataValue(translatedPoint.x); // Convert point.x to X Data Value
this.selectionAnnotation.y2 = yCalc.getDataValue(translatedPoint.y); // Convert point.y to Y Data Value

function getDefaultCoordCalculators() {
    const xAxis = this.parentSurface.xAxes.get(0);
    const yAxis = this.parentSurface.yAxes.get(0);
    if (!xAxis || !yAxis) {
      return { xCalc: undefined, yCalc: undefined };
    }

    const xCalc = xAxis.getCurrentCoordinateCalculator();
    const yCalc = yAxis.getCurrentCoordinateCalculator();

    return { xCalc, yCalc };
}
Read more about converting pixel coordinates to data-values here.
Note it gets a little more complex in multi-axis scenarios. The coordinate calculator instance is for the current axis and current draw phase only.
Best regards,
Andrew
- Andrew Burnett-Thompson answered 3 years ago
 Thanks for your response Andrew, using this example code on our heatmap results in the annotation displayed in the wrong location. I’ve attached a video to show this.
- You must login to post comments
Thanks for your response Andrew, using this example code on our heatmap results in the annotation displayed in the wrong location. I’ve attached a video to show this.
- Henrique Rodrigues answered 3 years ago
- You must login to post comments
Hi Henrique, can’t see the video but it’s possible that you need to translate mouse-coordinates (which are relative to the parent SciChartSurface) to the inner seriesViewRect.
More info in the documentation page here: Converting Pixel Coordinates to data Values
Scroll down to this part:
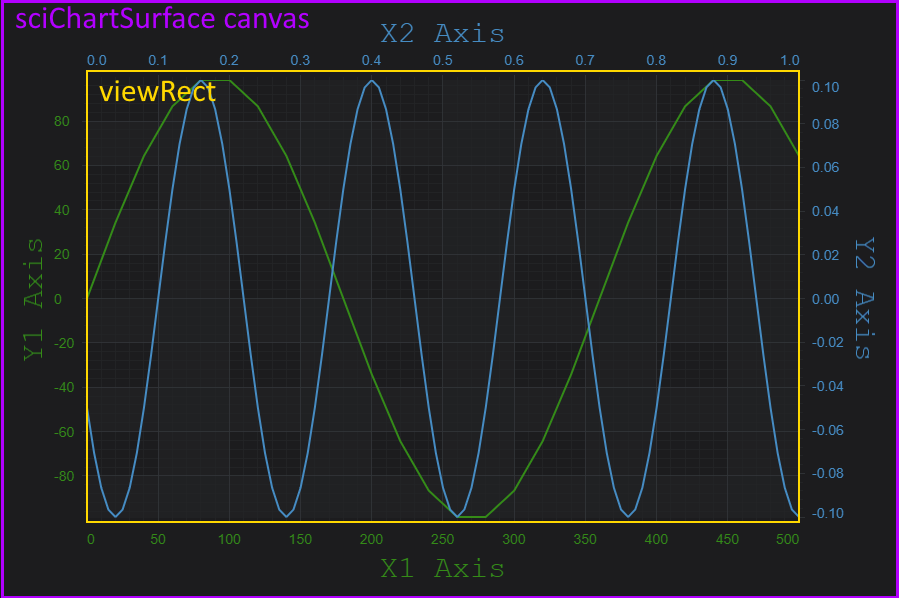
Transforming Pixels to the ViewRect
Functions exist to translate a point from the parent canvas of the chart to the viewRect. This is useful if you want to transform a mouse-coordinate on the parent canvas into a data-value on the chart….
If you are still stuck share a short code sample with the current behaviour and expected behaviour and we can find you a solution.
Best regards,
Andrew
- Andrew Burnett-Thompson answered 3 years ago
- You must login to post comments
Please login first to submit.
