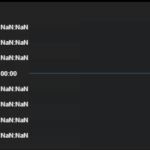
ZoomPanModifier date format charts zoom out continuously then showing NaN on the scale. It happened because the zoom level goes under the invalid date. Can you add the Minimum Zoom/Pan and Maximum Zoom/Pan area to be configured on options?
- Arun Surendran asked 3 years ago
 Hey Arun, this is a good suggestion and something we will look at. We already have zoom limit APIs in the other SciChart platforms (Windows, mobile) so can bring these to JS. For the moment, you can listen to VisibleRangeChanged event here. Use this callback to restrict or set the VisibleRange to a limit. https://www.scichart.com/documentation/js/current/webframe.html#Axis%20Ranging%20-%20How%20to%20Listen%20to%20VisibleRange%20Changes.html
 Thanks, @Andrew Burnett-Thompson for the response. Are you planning to implement the functionality to JS immediately or it will take time?
 Any update ???
- You must login to post comments
Hi Arun,
Thank you for the suggestion about ZoomPanModifier zooming out. We released version 1.2.1428 and it fixes this NaN issue for ENumericFormat.Date formats. If while zooming out visible range exceeds possible data values, the labels become hidden. Moreover it is possible now to set visibleRangeLimit to some value to limit the visible range while zooming out.
const { sciChartSurface, wasmContext } = await SciChartSurface.create(divElementId);
const xAxis = new CategoryAxis(wasmContext);
xAxis.labelProvider.numericFormat = ENumericFormat.Date_HHMM;
xAxis.visibleRangeLimit = new NumberRange(1, 10000);
Keep in mind if you are using CategoryAxis then the visible range contain indexes, not values, so it starting from 0.
- Michael Klishevich answered 3 years ago
 Hi Michael Klishevich… Thanks for the support. I have checked the visibleRangeLimit. It’s working fine on the zoom chart. But when pan the chart it’s going outside the limit.
 Any update?
 Hi Arun! We just published version 1.2.1434. It contains fix for both ZoomPanModifier and MouseWheelZoomModifier to respect visibleRangeLimit. Please check out this example https://demo.scichart.com/javascript-realtime-ticking-stock-charts Let us know if the problem is solved.
- You must login to post comments
Please login first to submit.

