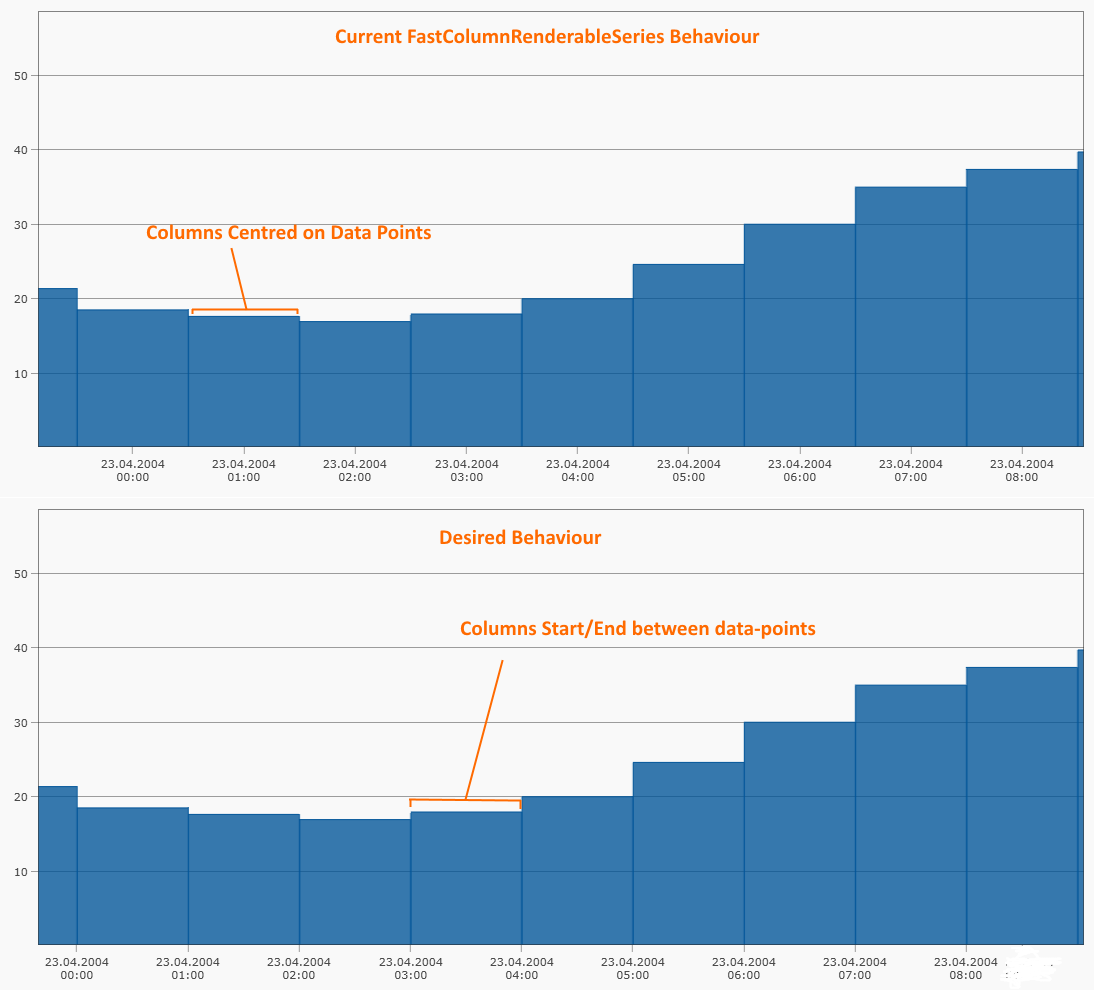
A question was just asked on Priority Support tickets on how to centre columns between data-values, and have each column join together with the next.
Our standard FastColumnRenderableSeries does allow columns to be touch each other by using the property DataPointWidth = 1.0. However, the columns are still centred on data-points.
Below we propose a workaround to achieve this desired visual affect
- You must login to post comments
To achieve the desired effect, we noticed that the Column Series bears many similarities with our Digital Mountain series.
To get a Digital Mountain Series, use FastMountainRenderableSeries with IsDigitalLine = true. You can see a demo of Digital Mountain Charts here.
Custom Mountain Renderable Series
Here is our custom renderable series, which inherits FastMountainRenderableseries and overrides InternalDraw. We allow the base mountain series to draw, then draw separator lines between ‘columns’ at each data-point.
public class CustomMountainSeries : FastMountainRenderableSeries
{
    public CustomMountainSeries()
    {
        this.IsDigitalLine = true;
    }

    protected override void InternalDraw(IRenderContext2D renderContext, IRenderPassData renderPassData)
    {
        // Draw base mountain
        base.InternalDraw(renderContext, renderPassData);

        // Get the coordinate calculators for coordinate transformation
        var xCalc = renderPassData.XCoordinateCalculator;
        var yCalc = renderPassData.YCoordinateCalculator;

        // Get the pixel coord for 'zero' on this series
        double zeroCoordY = yCalc.GetCoordinate(ZeroLineY);

        const double separatorLineOpacity = 1.0; // adjust this to get feint lines between 'columns'

        // Draw lines to zero separating columns
        using (var pen = renderContext.CreatePen(SeriesColor, AntiAliasing, StrokeThickness, separatorLineOpacity))
        {
            var pointSeries = renderPassData.PointSeries;

            for (int i = 0; i < pointSeries.Count; i++)
            {
                // Draw a vertical line to separate 'columns'
                var startPoint = new Point(xCalc.GetCoordinate(pointSeries.XValues[i]), yCalc.GetCoordinate(pointSeries.YValues[i]));
                var endPoint = new Point(xCalc.GetCoordinate(pointSeries.XValues[i]), zeroCoordY);
                renderContext.DrawLine(pen, startPoint, endPoint);
            }
        }
    }
}
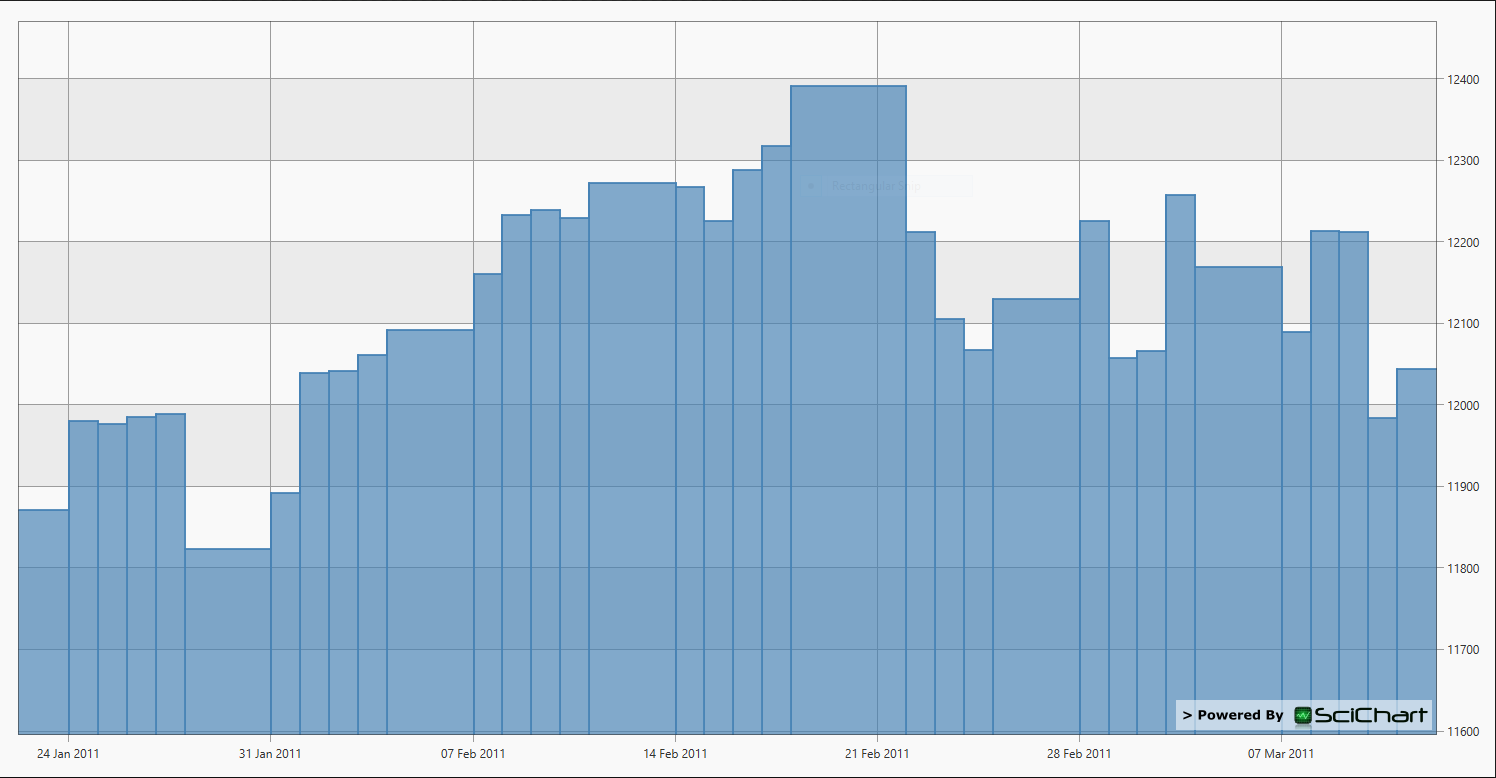
Here is the result!
Usage
To use it, simply include the CustomMountainSeries in your SciChartSurface as follows:
   <!--  Create the chart surface  -->
    <s:SciChartSurface Name="sciChart"
                       Grid.Row="1"
                       s:ThemeManager.Theme="BrightSpark">

        <!--  Declare RenderableSeries  -->
        <s:SciChartSurface.RenderableSeries>
            <createSimpleChart:CustomMountainSeries x:Name="mSeries"
                                            AreaBrush="#AA4682B4"
                                            IsDigitalLine="True"
                                            SeriesColor="SteelBlue"
                                            StrokeThickness="2" />
        </s:SciChartSurface.RenderableSeries>

        <!--  Create an X Axis  -->
        <s:SciChartSurface.XAxis>
            <s:DateTimeAxis/>
        </s:SciChartSurface.XAxis>

        <!--  Create a Y Axis  -->
        <s:SciChartSurface.YAxis>
            <s:NumericAxis GrowBy="0.1, 0.1" DrawMajorBands="True"/>
        </s:SciChartSurface.YAxis>

    </s:SciChartSurface>
- Andrew Burnett-Thompson answered 9 years ago
- You must login to post comments
