Hello, everyone.
I want to add annotations for analyzing 3d charts.
In order to do that, it is necessary to be able to make several marks on the X-axis, Y-axis, and Z-axis, and I would like to know the best practices.
please check the attached picture. It is similar with cursor but it’s fixed.
I found Custom Geometry documents.
https://www.scichart.com/documentation/win/current/webframe.html#Adding%20Cubes%20and%20Custom%20Geometry%20to%20the%20Chart.html
but I am not sure this is for the best.
Thanks,
Kim, JinSeok.

- JINSEOK KIM asked 7 months ago
- You must login to post comments
Hi Kim,
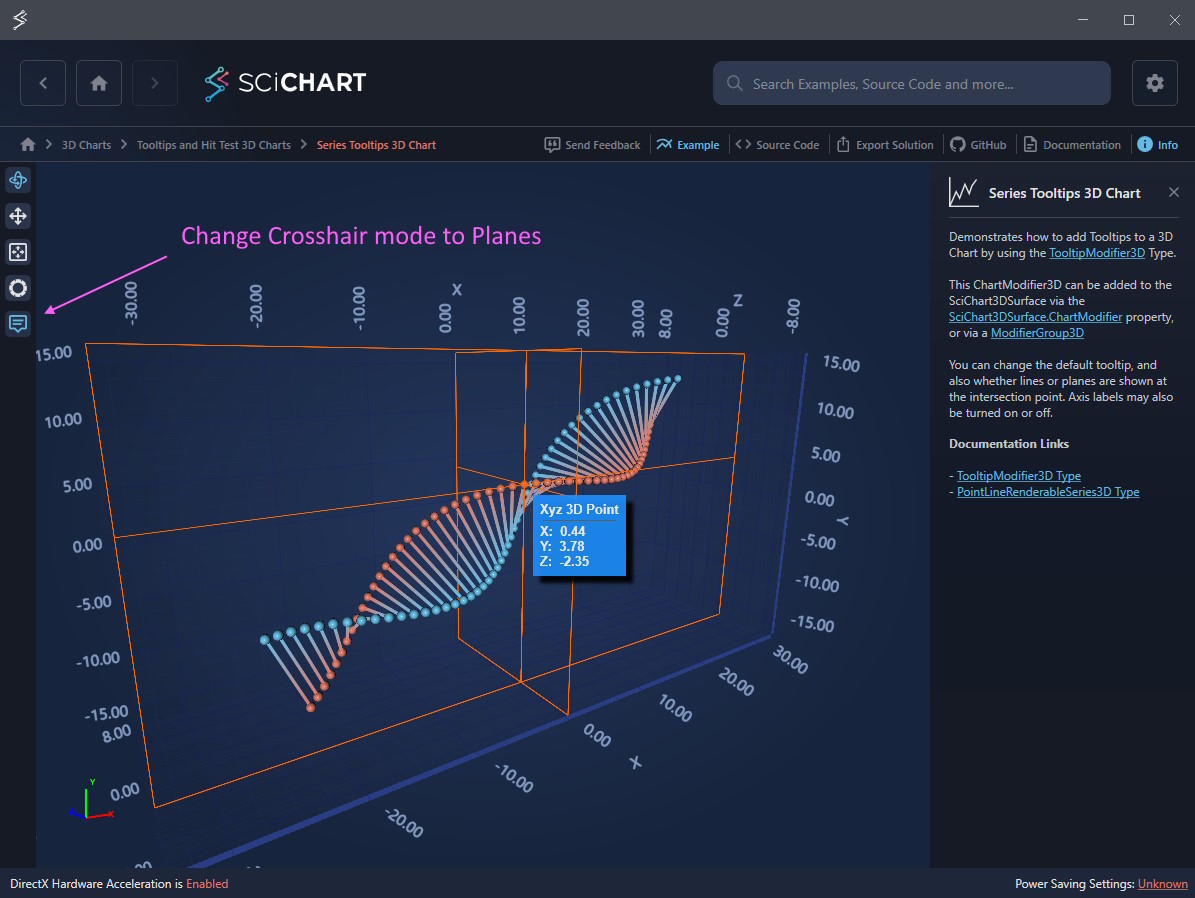
We don’t have an API for 3D annotations however it is possible to place planes and labels on the 3D chart using our BaseSceneEntity API. A demonstration of this can be found in the TooltipModifier3D which has a CrosshairMode property allowing you to draw planes to the axis wall.
Do you have an active support subscription? If so our team can create a solution for you and send it.
Best regards,
Andrew
- Andrew Burnett-Thompson answered 7 months ago
- last edited 7 months ago
- You must login to post comments
Please login first to submit.
