I am trying to add Zoom capability to application that is based on ECG Monitor sample. As ECG Monitor manages VisibleRange, I need to stop setting VisibleRange when zoom is started. I am setting flag in RubberBandXyZoomModifier.OnModifierMouseDown.
Is there any way to create a custom ChartModifier to be notified when the user clicks mouse down on the chart, or axis?
- manishdoshi asked 12 years ago
- last edited 9 years ago
- You must login to post comments
Hi Manish,
I’ve just investigated this now – you’re absolutely right! The above code doesn’t work on the axes. Here. Try this – its a custom modifier I’ve developed which demonstrates hit testing of the YAxis and XAxis.
This code lets you detect click on axis.
public class HitTestingModifier : ChartModifierBase
{
    public override void OnModifierMouseDown(ModifierMouseArgs e)
    {
        bool isOnChart = IsPointWithinBounds(e.MousePoint, ModifierSurface);
        bool isOnYAxis = IsPointWithinBounds(e.MousePoint, YAxis);
        bool isOnXAxis = IsPointWithinBounds(e.MousePoint, XAxis);

        MessageBox.Show(string.Format("Clicked YAxis? {0}\nClicked XAxis? {1}\nClicked Chart? {2}", isOnYAxis,
                                        isOnXAxis, isOnChart));

        base.OnModifierMouseDown(e);
    }

    public bool IsPointWithinBounds(Point point, IHitTestable element)
    {
        var tPoint = ParentSurface.RootGrid.TranslatePoint(point, element);

        bool withinBounds = (tPoint.X <= (element as FrameworkElement).ActualWidth && tPoint.X >= 0)
                            && (tPoint.Y <= (element as FrameworkElement).ActualHeight && tPoint.Y >= 0);

        return withinBounds;
    }
}
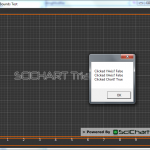
If you click in the XAxis, YAxis or chart region you will get a message box showing what element has been clicked.
Example attached
Thanks!
- Andrew Burnett-Thompson answered 12 years ago
- last edited 6 years ago
- You must login to post comments
Please login first to submit.

