Hi SciChart team,
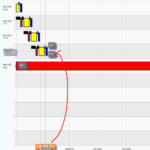
I have built a xyscatter chart with DateTime type X-Axis and Double type Y-Axis,
and built boxannotations to mark areas.
May I set the x-Axis value in the tooltip?
Or can I show properties of each item which means every point in the xyscatterseries, and customize the tooltip content style like adding the description of every properties.
- Wade Yao asked 3 years ago
- You must login to post comments
Hi Wade,
Thanks for your inquiry. I am sorry for the late reply.
Please take a look at our “Using RolloverModifier Tooltips” example:
https://www.scichart.com/example/wpf-chart-example-using-rollovermodifier-tooltips/
Is this what you are looking for?
With best regards,
Oleksandr
- Oleksandr Shvets answered 3 years ago
- You must login to post comments
Please login first to submit.

