SciChart® the market leader in Fast WPF Charts, WPF 3D Charts, iOS Chart, Android Chart and JavaScript Chart Components
SciChart WPF ships with hundreds of WPF Chart Examples which you can browse, play with, view the source-code and even export each WPF Chart Example to a stand-alone Visual Studio solution. All of this is possible with the new and improved SciChart WPF Examples Suite, which ships as part of the SciChart WPF SDK.
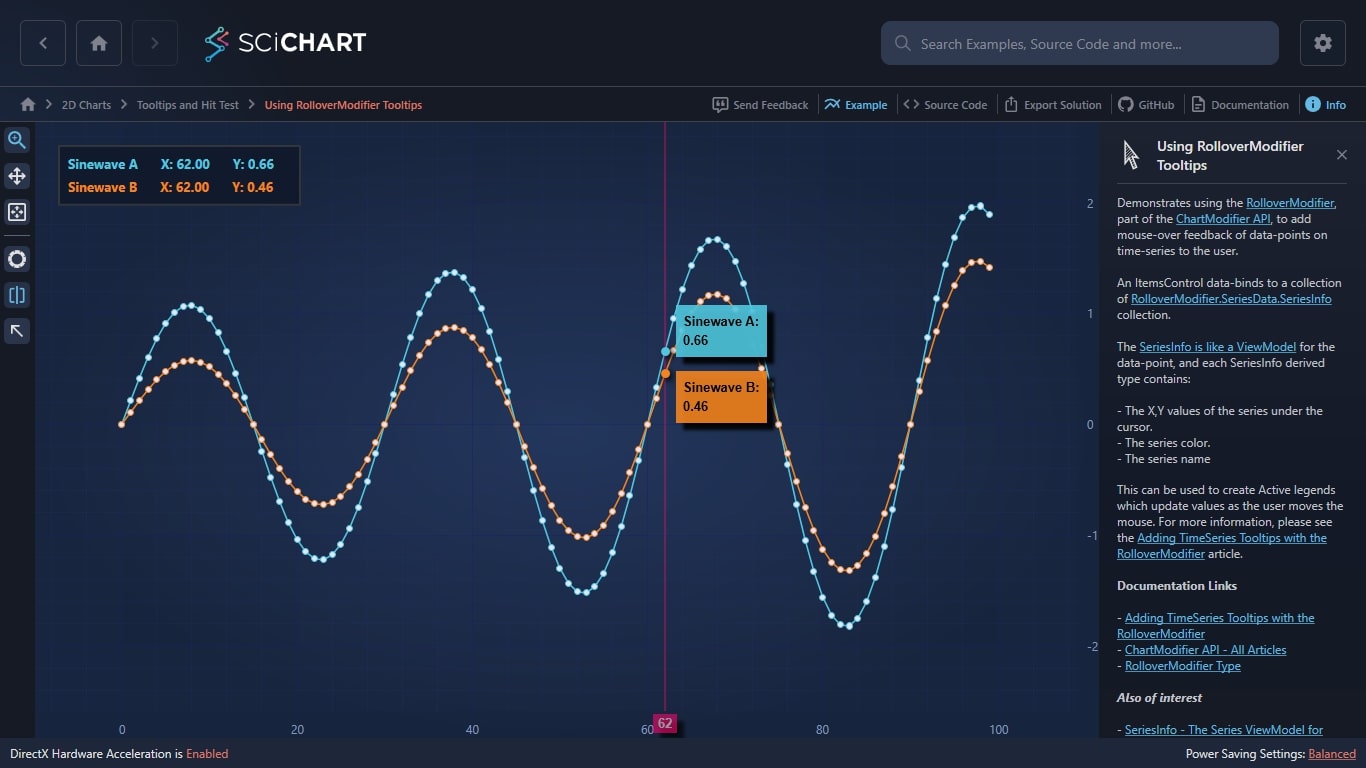
Demonstrates using the RolloverModifier, part of the ChartModifier API, to add mouse-over feedback of data-points on time-series to the user.
An ItemsControl data-binds to a collection of RolloverModifier.SeriesData.SeriesInfo collection.
The SeriesInfo is like a ViewModel for the data-point, and each SeriesInfo derived type contains:
– The X,Y values of the series under the cursor.
– The series color.
– The series name
This can be used to create Active legends which update values as the user moves the mouse. For more information, please see the Adding TimeSeries Tooltips with the RolloverModifier article.
Documentation Links
– Adding TimeSeries Tooltips with the RolloverModifier
– ChartModifier API – All Articles
– RolloverModifier Type
Also of interest
– SeriesInfo – The Series ViewModel for Legends, Tooltips, Rollovers
– XySeriesInfo Type
– XyzSeriesInfo Type
– XyStackedSeriesInfo Type
– HlcSeriesInfo Type
– OhlcSeriesInfo Type
– BandSeriesInfo Type
– BoxPlotSeriesInfo Type
The C#/WPF source code for the WPF Chart Using RolloverModifier Tooltips example is included below (Scroll down!).
Did you know you can also view the source code from one of the following sources as well?
<UserControl x:Class="SciChart.Examples.Examples.InspectDatapoints.RolloverFeedback"
xmlns="http://schemas.microsoft.com/winfx/2006/xaml/presentation"
xmlns:x="http://schemas.microsoft.com/winfx/2006/xaml"
xmlns:d="http://schemas.microsoft.com/expression/blend/2008"
xmlns:ext="http://schemas.abtsoftware.co.uk/scichart/exampleExternals"
xmlns:mc="http://schemas.openxmlformats.org/markup-compatibility/2006"
xmlns:s="http://schemas.abtsoftware.co.uk/scichart"
d:DesignHeight="400"
d:DesignWidth="600"
mc:Ignorable="d">
<UserControl.Resources>
<s:ColorToBrushConverter x:Key="ColorToBrushConverter" />
<Style x:Key="Series1SelectedStyle" TargetType="s:FastLineRenderableSeries">
<Setter Property="Stroke" Value="LightSteelBlue" />
<Setter Property="StrokeThickness" Value="3" />
</Style>
<Style x:Key="Series2SelectedStyle" TargetType="s:FastLineRenderableSeries">
<Setter Property="Stroke" Value="LimeGreen" />
<Setter Property="StrokeThickness" Value="3" />
</Style>
<s:EffectConverter x:Key="EffectConverter"/>
<DropShadowEffect x:Key="LegendDropShadow"
BlurRadius="10"
Direction="-45"
ShadowDepth="5"
Color="Black" />
</UserControl.Resources>
<Grid>
<Grid.ColumnDefinitions>
<ColumnDefinition Width="Auto" />
<ColumnDefinition Width="*" />
</Grid.ColumnDefinitions>
<ext:SciChartInteractionToolbar x:Name="UserToolbar" TargetSurface="{Binding Source={x:Reference Name=sciChartSurface}}" />
<s:SciChartSurface x:Name="sciChartSurface" Grid.Column="1">
<!-- Declare Axes -->
<s:SciChartSurface.XAxis>
<s:NumericAxis GrowBy="0.1, 0.1" />
</s:SciChartSurface.XAxis>
<s:SciChartSurface.YAxis>
<s:NumericAxis GrowBy="0.1, 0.1" />
</s:SciChartSurface.YAxis>
<!-- Declare RenderableSeries -->
<s:SciChartSurface.RenderableSeries>
<!-- Declare first line series with a PointMarker and RolloverMarker control template -->
<s:FastLineRenderableSeries SelectedSeriesStyle="{StaticResource Series1SelectedStyle}"
Stroke="SteelBlue"
StrokeThickness="2">
<s:FastLineRenderableSeries.PointMarker>
<s:EllipsePointMarker Width="7"
Height="7"
Fill="Lavender"
StrokeThickness="1" />
</s:FastLineRenderableSeries.PointMarker>
<s:FastLineRenderableSeries.SeriesAnimation>
<s:WaveAnimation AnimationDelay="0:0:1" Duration="0:0:3" PointDurationFraction="0.4"/>
</s:FastLineRenderableSeries.SeriesAnimation>
</s:FastLineRenderableSeries>
<!-- Declare second line series with a PointMarker and RolloverMarker control template -->
<s:FastLineRenderableSeries SelectedSeriesStyle="{StaticResource Series2SelectedStyle}"
Stroke="DarkGreen"
StrokeThickness="2">
<s:FastLineRenderableSeries.PointMarker>
<s:EllipsePointMarker Width="7"
Height="7"
Fill="Lavender"
StrokeThickness="1" />
</s:FastLineRenderableSeries.PointMarker>
<s:FastLineRenderableSeries.SeriesAnimation>
<s:WaveAnimation AnimationDelay="0:0:1" Duration="0:0:3" PointDurationFraction="0.4"/>
</s:FastLineRenderableSeries.SeriesAnimation>
</s:FastLineRenderableSeries>
<s:FastLineRenderableSeries IsVisible="False" Stroke="DarkRed" />
</s:SciChartSurface.RenderableSeries>
<!-- Declare ChartModifiers -->
<s:SciChartSurface.ChartModifier>
<s:ModifierGroup>
<s:RolloverModifier x:Name="RolloverModifier"
ReceiveHandledEvents="True"
DrawVerticalLine="True"
ShowTooltipOn="MouseHover"
SourceMode="AllVisibleSeries" />
<s:SeriesSelectionModifier IsEnabled="False" ReceiveHandledEvents="True" />
</s:ModifierGroup>
</s:SciChartSurface.ChartModifier>
</s:SciChartSurface>
<!-- Binds to RolloverModifier.SeriesInfo.SeriesInfo, outputs X-Values, Y-Values -->
<!-- By modifying this and using knowledge of SeriesInfo class definition above, -->
<!-- you can theoretically do anything! -->
<!-- -->
<!-- NOTE: See the RolloverModifier documentation for alternatives, such as binidng to a SciChartLegend -->
<!-- https://www.scichart.com/documentation/win/current/webframe.html#RolloverModifier.html -->
<Border Grid.Column="1"
Margin="23,23"
HorizontalAlignment="Left"
VerticalAlignment="Top"
Background="#77222222"
BorderBrush="#323539"
BorderThickness="2"
Padding="5"
Effect="{Binding Path=(s:EffectManager.EnableDropShadows), Converter={StaticResource EffectConverter}, ConverterParameter={StaticResource LegendDropShadow}}">
<ItemsControl ItemsSource="{Binding Source={x:Reference Name=RolloverModifier}, Path=SeriesData.SeriesInfo}">
<ItemsControl.ItemTemplate>
<DataTemplate>
<Grid>
<Grid.ColumnDefinitions>
<ColumnDefinition />
</Grid.ColumnDefinitions>
<!-- Bind to the SeriesName using the Stroke as text foreground -->
<TextBlock Grid.Column="0"
Margin="3,3,20,3"
FontSize="13"
FontWeight="Bold"
Foreground="{Binding Stroke,
Converter={StaticResource ColorToBrushConverter}}"
Text="{Binding SeriesName}" />
<!-- Bind to the Series Value, using the Stroke as text foreground -->
<!-- When binding to XValue, YValue of type IComparable, StringFormat is mandatory due to a -->
<!-- XAML bug that cannot convert IComparable to text, even though underlying type is double -->
<StackPanel Grid.Column="1"
Margin="3,3,20,3"
Orientation="Horizontal">
<TextBlock FontSize="13"
FontWeight="Bold"
Foreground="{Binding Stroke,
Converter={StaticResource ColorToBrushConverter}}"
Text="{Binding XValue,
StringFormat=X: \{0:0.00\}}" />
</StackPanel>
<StackPanel Grid.Column="2"
Margin="3,3,20,3"
Orientation="Horizontal">
<TextBlock FontSize="13"
FontWeight="Bold"
Foreground="{Binding Stroke,
Converter={StaticResource ColorToBrushConverter}}"
Text="{Binding YValue,
StringFormat=Y: \{0:0.00\}}" />
</StackPanel>
</Grid>
</DataTemplate>
</ItemsControl.ItemTemplate>
</ItemsControl>
</Border>
</Grid>
</UserControl>
// *************************************************************************************
// SCICHART® Copyright SciChart Ltd. 2011-2022. All rights reserved.
//
// Web: http://www.scichart.com
// Support: support@scichart.com
// Sales: sales@scichart.com
//
// RolloverFeedback.xaml.cs is part of the SCICHART® Examples. Permission is hereby granted
// to modify, create derivative works, distribute and publish any part of this source
// code whether for commercial, private or personal use.
//
// The SCICHART® examples are distributed in the hope that they will be useful, but
// without any warranty. It is provided "AS IS" without warranty of any kind, either
// expressed or implied.
// *************************************************************************************
using System;
using System.Windows;
using System.Windows.Controls;
using SciChart.Charting.Model.DataSeries;
using SciChart.Data.Model;
namespace SciChart.Examples.Examples.InspectDatapoints
{
public partial class RolloverFeedback : UserControl
{
public RolloverFeedback()
{
InitializeComponent();
Loaded += RolloverFeedbackLoaded;
}
private void RolloverFeedbackLoaded(object sender, RoutedEventArgs e)
{
sciChartSurface.YAxis.GrowBy = new DoubleRange(0.2, 0.2);
var seriesA = new UniformXyDataSeries<double>();
var seriesB = new UniformXyDataSeries<double>();
var seriesC = new UniformXyDataSeries<double>();
seriesA.SeriesName = "Sinewave A";
seriesB.SeriesName = "Sinewave B";
seriesC.SeriesName = "Sinewave C";
double count = 100.0;
double k = 2 * Math.PI / 30.0;
for (int i = 0; i < (int)count; i++)
{
var phi = k * i;
seriesA.Append((1.0 + i / count) * Math.Sin(phi));
seriesB.Append((0.5 + i / count) * Math.Sin(phi));
seriesC.Append(i / count * Math.Sin(phi));
}
sciChartSurface.RenderableSeries[0].DataSeries = seriesA;
sciChartSurface.RenderableSeries[1].DataSeries = seriesB;
sciChartSurface.RenderableSeries[2].DataSeries = seriesC;
}
}
}