Hello,
I’m Using the FastMountainRenderableSeries to fill the area under/over the Data points with a color gradient.
However, the gradient always seems to adapt to the currently shown data values and uses the maximal and minimal value of the displayed data as the “poles” for the coloring.
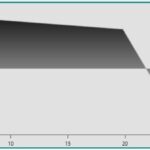
In the attached image, Data is displayed with a maximal value of 2 and a minimal value of -2. The gradient (from white to black) uses these values to map the color. -2 corresponds to white and 2 corresponds to black, and the room between is interpolated.
If I were to change the displayed data to have a different max/min value, the gradient would adapt accordingly.
Here is the relevant code I’m using:
FastMountainRenderableSeries m_graph = new FastMountainRenderableSeries();
m_graph.ZeroLineY = 0;
m_graph.AntiAliasing = true;
m_graph.Fill = new LinearGradientBrush(Colors.Black, Colors.White, 90);…adding datapoints…
My question is, is there is a way to gain more control over the way the colors of the gradient are mapped onto the area under/over the data points?
For example, maybe I want the black->white gradient only to go from 2->1 and everything above 2 is black and everything below 1 is white, no matter what range the displayed values currently have.
Ideally it would be possible to create/overwrite a “color-mapping”-function that accepts double values and returns colors to fill the are under/over the data points.
Thank you.
- Marc Vahldieck asked 1 year ago
- You must login to post comments
Hi Marc
When applying a gradient brush to FastMountainRenderableSeries.Fill SciChart WPF maps the texture to the viewport, not the object that has been rendered. So if you pan the chart up/down then the gradient can appear to change.
FastColumnRenderableSeries does have another property: FillBrushMappingMode which accepts TextureMappingMode.PerScreen or PerPrimitive which has some extra options, however it’s still not fine-grained control over the color mapping.
Unfortunately there is no way to color-map a gradient to a Y-range in SciChart yet, we can consider it as a feature request for the future.
Best regards
Andrew
- Andrew Burnett-Thompson answered 1 year ago
- You must login to post comments
Hello Andrew,
thank you for the quick reply.
I understand.
Best regards
- Marc Vahldieck answered 1 year ago
 Hi Marc, thanks appreciate it. We will see if we can improve this in future – a TextureMapping.PerPrimitive exists for columns, something like this could be made to work with mountain as well. Best regards, Andrew
- You must login to post comments
Please login first to submit.

