Hi,
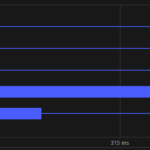
Y-values are only 0 or 1. (0 is thin line, 1 is thick line)
Axis-Y Label means series name.
I want to do something like in the attached picture.
- JaeHyun Kim asked 3 years ago
- You must login to post comments
Hi JaeHyun,
This looks very similar to a Timeline series or a Gannt chart. We don’t have a chart type like this in SciChart out of the box, but it is possible to create something like this either with Annotations or with the CustomRenderableSeries API.
What exactly are you trying to build and what is your requirement?
Best regards,
Andrew
- Andrew Burnett-Thompson answered 3 years ago
- You must login to post comments
Please login first to submit.

