Hello support team.
I have a question about the resampling modes and their behavior.
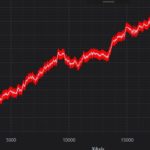
I have a LineRenderableSeries with the resampling mode.mid. Therefore, depending on the zoom level and available pixels of the display screen, the information of the min and max values are lost. I had the idea to create a second LineRenderableSeries with the Opacity 0.5 and the ResamplingMode.Min Max. Thus I have behind the main line with the resampling mode.mid a “cloud” with the MinMax info. This allows the user to see this information as well. However, I would deactivate this cloud if it is not necessary due to the zoom level and the pixels.
How can I request this from SciChartControl? Or does it make more sense to use a different functionality?
I use the Mvvm classes LineRenderableSeriesViewModel, and XyDataSeries.
Thank you very much!
- Andreas Köhler asked 6 years ago
- You must login to post comments
Hi Andreas
There is no exposed API of whether resampling is being used or not. This is calculated internally to SciChart using something like this:
    internal static bool RequiresReduction(ResamplingMode resamplingMode, IndexRange pointIndices, int viewportWidth)
    {
        var setLength = pointIndices.Max - pointIndices.Min + 1;
        var resampledLength = 4 * viewportWidth;

        return resamplingMode != ResamplingMode.None & setLength > resampledLength;
    }
In actual fact the real detection of resampling is more complex than that. I would suggest looking at the number of points in your Viewport and the size of the viewport and based on the ratio between the two, toggling your modes.
What are you trying to achieve by the way? As you’ve pointed out, ResamplingMode.Mid will lose some data. Is that desired?
Best regards,
Andrew
- Andrew Burnett-Thompson answered 6 years ago
 If you compare the two screens “WithMinMaxInfo(1).jpg” and “AutoMode.jpg”, you will see that AutoMode always creates a thick band and the user has to execute an averaging algorithm in his brain :). With my approach to show the user the averaged values and a slightly transparent band in the background as Min/Max Info, it is much easier for the user. And as you can see, it’s really more convenient than interpreting the data by the user. What is only needed is the information whether it is necessary to display this band. And exactly this I would have realized by asking SciChartControl if it was necessary to resample the data.
 The band is because your data actually crosses those levels. You can set ResamplingMode.None and see what the chart looks like without resampling. If we’ve done our job right Auto vs. None should be virtually the same. It sounds to me that you want to smooth the data to make it look less noisy when zoomed out but at the same time to not lose significant peaks + troughs, is that correct? I’m not really sure what to suggest in this case as SciChart doesn’t have such a feature. You can experiment with our Filters API which allows some smoothing of data maybe?
 “It sounds to me that you want to smooth the data to make it look less noisy when zoomed out but at the same time to not lose significant peaks + troughs, is that correct?” That is exactly what I want to realize. And it works as you can see on the screenshots. The only thing missing now is to make the red band invisible when no resampling was necessary. And this action, i.e. to make the red line invisible, I have to perform. For this I only need the information whether a resampling of the data was necessary. I am sure SciChart has the information. I just can’t get that information. I’m looking forward to hearing from you. Andreas
 Hello, Andrew, can you help me with my problem now or will this functionality not be available in the next time. General: Can’t this functionality be of general interest to you? I would like a brief answer. Thank you very much! Andreas
 Hi Andreas, I’ve already given you the calculation we use internally to determine when to use resampling. You can try that? PointIndices is the index of the points in the viewport e.g. if you have 10000 points and points 100-200 are visible then PointIndices = 100 to 200. ViewportWidth is the width of the viewport in pixels.
- 2 more comments
- You must login to post comments
Please login first to submit.


