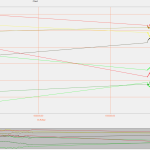
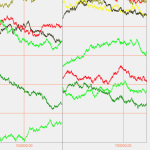
I am using XyDataSeries<double, double> and when the chart receives data it can happen that the user stops accepting data and wants to resume recording data at a later point. Just like a doctor taking a EEG. He starts the printout and then stops. Tells the patient to do something and resumes the printout. Then he sees the 2 recordings side by side. Separated by a vertical line – no gaps. Thats what I want to achieve. But currently my chart looks like this.
What do I have to set to get the desired result? (Ignore missing values inbetween if all series don’t have data.
I was also already making an annotation which worked until I included the stop in appending. Now I don’t see the annotation any more but my real problem is that I want to have no gap. The drawing of the lines should resume at the point where it stopped before.
I tried unsorteddata but no change. And I was looking for an unevenlySpaced property but there was none to my series.
EDIT
I added a picture put together from the first with how I would like to have it look from the same data. I would like to have no gaps in between the 2 data points.
- Uwe Hafner asked 9 years ago
- last edited 9 years ago
- You must login to post comments
See comments to Andrews answer. The answer for my use case seems to be:
Use CategoryDateTimeAxis if possible.
http://support.scichart.com/index.php?/Knowledgebase/Article/View/17190/29/categorydatetimeaxis-vs-datetimeaxis
https://www.scichart.com/questions/question/removing-intervals-from-datetimeaxis
- Uwe Hafner answered 9 years ago
- You must login to post comments
Hi Uwe,
Please see this prevous question which covers rendering gaps in line series.
Best regards,
Andrew
- Andrew Burnett-Thompson answered 9 years ago
 If you want to insert a gap into a DataSeries, the only way is to add a point with X=last X and Y=double.NaN and to use the FastLineRenerableSeries.DrawNanAs property to choose 'Gaps'. This breaks the series into segments. This is the only way to do it other than overriding the rendering of FastLineRenderableSeries completely.
 I tried to provide more information in the edit of the question. I actually don't try to get a gap but to remove the one that is visible. Is this possible?
 Ah I understand, you want to collapse gaps in the data. What you are looking for is called a DiscontinuousDateTimeAxis https://www.scichart.com/questions/question/removing-intervals-from-datetimeaxis and no we do not support it yet as doing so will introduce many performance problems. The closest implementation is the CategoryDateTimeAxis, which is described here http://support.scichart.com/index.php?/Knowledgebase/Article/View/17190/29/categorydatetimeaxis-vs-datetimeaxis
 I had seen that but I was hoping to find that for double series. So I have the option to see if I can switch to categoryDateTimeAxis or to override rendering of FastLineRenderableSeries? What does it imply to override the rendering. Do you have an article on that? (Sounds like heavy lifting?)
 For what you want to do (collapse the entire chart between two points where there is no data), the only option is to use CategoryDateTimeAxis
- 1 more comment
- You must login to post comments
Please login first to submit.


