Hello,
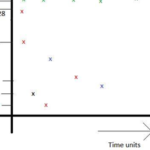
My requirement is to plot 3 dimensional data(x,y,z) in 2 D WPF chart. I know this is possible with bubble chart. But , i would like the plot to be seen as shown in the attached image file. I would like have Crossmark point marker instead of bubble(ellipse marker?) and crossmark should not be scaled according to z value(no scaling of point marker and it should be of default size ).
Please let me know how to achieve this one?
- deepak b asked 5 years ago
- You must login to post comments
Hi there,
Thanks for your question.
You can use Scatter Series Type for the Chart on your image. Please see the Scatter Series Type documentation for more info:
https://www.scichart.com/documentation/v5.x/webframe.html#The%20Scatter%20Series%20Type.html
Please note that you have to provide new XyDataSeries<> based on the data you have.
You can also use XPointMarkers to draw Crossmarks. Please see the Point Marker API documentation:
https://www.scichart.com/documentation/v5.x/webframe.html#Point%20Marker%20API%20-%20BaseRenderableSeries.Pointmarker.html
Hope this helps.
- Oleksandr Shvets answered 5 years ago
- You must login to post comments
Please login first to submit.

