Hi,
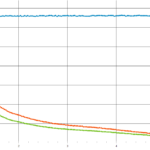
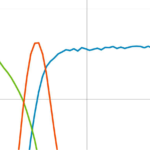
When using the SciChartSurface.ExportToBitmapSource(useXamlRenderSurface: true) to export graph at large size for printing (e.g. at 600 DPI, when the screen is at 96 DPI), the grid lines and axis tick lines do not scale, and point markers are missing. Text, StrokeThickness of line series and legends are shown correctly.
Is it an issue in the renderer? Or is there any setting for the renderer to render them correctly?
Params of the attached graph:
LineSeriesStyle.StrokeThickness = 2,
MajorTickLineStyle.StrokeThickness = 1,
MinorTickLineStyle.StrokeThickness = 1,
MajorGridLineStyle.StrokeThickness = 1,
EllipsePointMarker.StrokeThickness = 1, Width = 6, Height = 6
Thanks,
Kawai
- Kawai Lo asked 6 years ago
- You must login to post comments
Please login first to submit.


