Hello,
I am currently using a rollover modifier to display tooltip values on the trend. Whenever a data point is clicked however, the trend stretches so this point is along the right hand axis, and it pans so this point is along the x-axis. Is there a way to disable this feature?
Here are my modifier declarations:
<SciChart:SciChartSurface.ChartModifier>
            <SciChart:ModifierGroup>
                <SciChart:RubberBandXyZoomModifier  IsXAxisOnly="False"/>
                <SciChart:XAxisDragModifier/>
                <SciChart:CursorModifier ShowAxisLabels="False"/>
                <SciChart:RolloverModifier ReceiveHandledEvents="False" ShowTooltipOn="Always" ShowAxisLabels="True" UseInterpolation="True" SnapsToDevicePixels="False" TooltipLabelTemplate="{StaticResource RolloverLabelTemplate}"/>
            </SciChart:ModifierGroup>
        </SciChart:SciChartSurface.ChartModifier>
Thanks,
Andrew
- Andrew Moghadam asked 9 years ago
- last edited 9 years ago
- You must login to post comments
Hi Andrew,
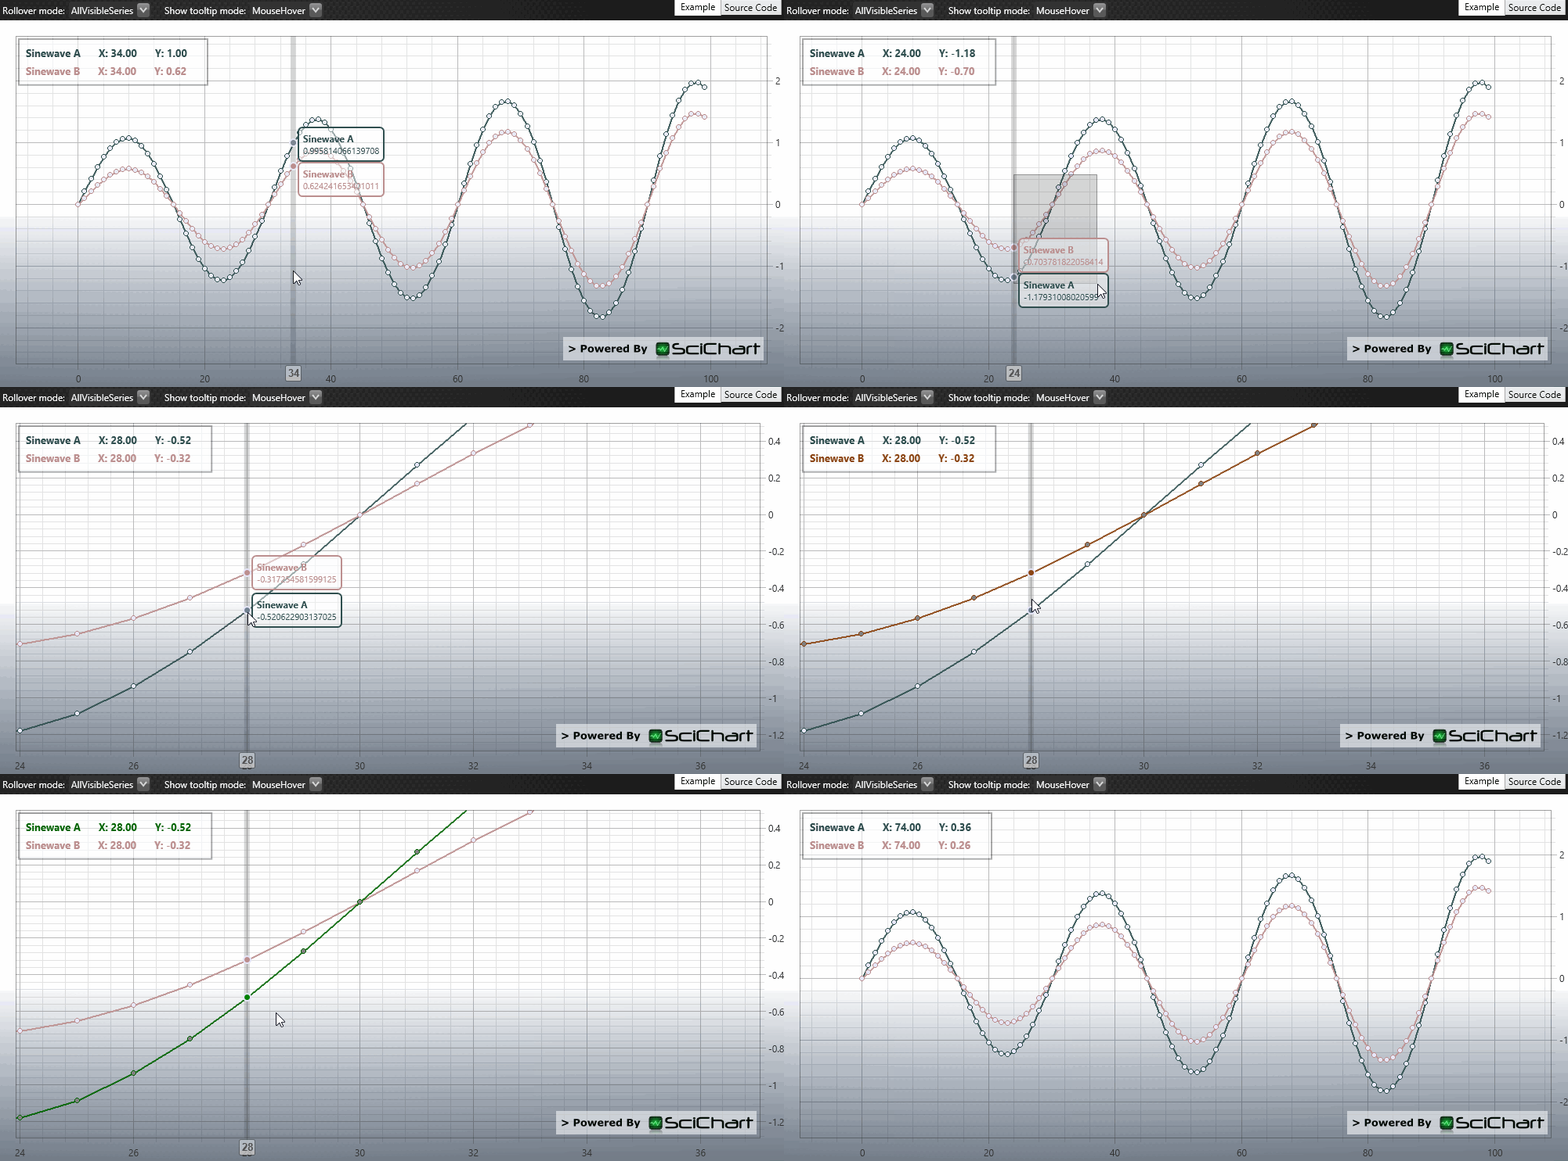
I actually am unable to reproduce this. I modified our example ‘Rollover Feedback’ to include a RubberBandXyZoomModifier. Changes from our examples include:
Taking the original RolloverFeedback example in our Examples Suite (I am testing v3.3) then
- Set XAxis, YAxis.AutoRange = Once
- add RubberBandXyZoomModifier before rollover
- add ZoomExtentsModifier after rollover
As you can see from the animation below, you can zoom, click on a marker and it doesn’t zoom to extents until you double click on the chart.

Can you try building up a new sandbox application just with SciChartSurface and modifiers and some dummy data. Does the problem occur then? If so, send over the solution and we can investigate.
Best regards,
- Andrew Burnett-Thompson answered 9 years ago
- You must login to post comments
Please login first to submit.
