Hello,
I use a Scrollbar/Surface combination to have an overview over several RenderSeries. Since I need individual scaling on each Series I also add 1 YAxis per Renderseries
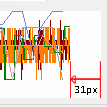
The problem is that (even when disabling everything drawing related to an axis) adding an axis adds 2 px of white space where the axis would be.
In the attached image you can see an example with 15 axes added.
Here’s the code adding the RenderSeries and the axis (we already tried so many things to make the whitespace disappear as you can see in “createNewAxis”):
public void AddSciRenderSeries(FastLineRenderableSeries renderableSeries)
{
    if (OverviewChartSurface.RenderableSeries.Contains(renderableSeries))
        return;

    OverviewChartSurface.YAxes.Add(createNewAxis(renderableSeries.YAxisId));
    OverviewChartSurface.RenderableSeries.Add(renderableSeries);
    OverviewChartSurface.ZoomExtents();
}

private NumericAxis createNewAxis(string channelId)
{
    NumericAxis scrollerYAxis1 = new NumericAxis();
    scrollerYAxis1.AutoRange = SciChart.Charting.Visuals.Axes.AutoRange.Always;

    scrollerYAxis1.DrawMajorBands = false;
    scrollerYAxis1.DrawMajorGridLines = false;
    scrollerYAxis1.DrawMajorTicks = false;
    scrollerYAxis1.DrawMinorGridLines = false;
    scrollerYAxis1.DrawMinorTicks = false;
    scrollerYAxis1.DrawLabels = false;

    scrollerYAxis1.BorderBrush = Brushes.Red;
    scrollerYAxis1.FontSize = 0.1;
    Trace.WriteLine("AxisOffset: " + scrollerYAxis1.GetAxisOffset());
    scrollerYAxis1.Padding = new Thickness(0);
    scrollerYAxis1.Margin = new Thickness(0);
    scrollerYAxis1.BorderThickness = new Thickness(0);
    scrollerYAxis1.Id = channelId;

    return scrollerYAxis1;
}
What shall we do to remove the gap on the right?
Thanks for your help!
- Tony Richter asked 3 years ago
- You must login to post comments
Ok, I just found out that setting yaxis.Width = 0; solves the problem for us. The occupied space of the axis is then reduced to 0px.
- Tony Richter answered 3 years ago
- You must login to post comments
Please login first to submit.

