Hello,
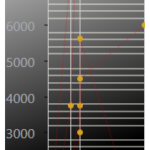
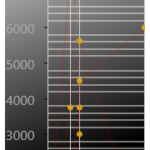
I have the problem, that sometimes only one label is shown on the X-Axis even when there is space to show some more, than only one.
The property “IsLabelCullingEnabled” would show them all, but than it is ugly if there is not enough space.
So what can I do to have some more Labels shown?
In the Screenshots you can see that with only a few pixels more, more labels are shown, but the could have been also shown with less pixels (Especially Label “1” and “22” could have been shown).
- Nick Müller asked 5 years ago
- You must login to post comments
Hi Nick,
Thanks for your inquiry.
You can create your own TickProvider to customize Axis Ticks. Please take a look at the corresponding documentation for more info:
https://www.scichart.com/documentation/v5.x/webframe.html#Axis%20Ticks%20-%20TickProvider%20and%20DeltaCalculator%20API.html
Hope this helps.
- Oleksandr Shvets answered 5 years ago
 Well, maybe I need to add a comment instead of an answer: Hi Oleksandr, I have already a custom axis tick provider for the X-Axis. Which I used to have these unsteady intervals (1, 6, 8, 22). Is there any other way to display the label ticks when there is enough space to display them, or have I overseen something in the custom tick provider? Best Regards, Nick
- You must login to post comments
Hi Oleksandr,
I have already a custom axis tick provider for the X-Axis. Which I used to have these unsteady intervals (1, 6, 8, 22).
Is there any other way to display the label ticks when there is enough space to display them, or have I overseen something in the custom tick provider?
Best Regards,
Nick
- Nick Müller answered 5 years ago
- You must login to post comments
Please login first to submit.


