Hello!
I’m building an application where I need to display quiet a large number of charts next to each other.
In this app the user can select up to 16 devices at the same time, each device having 24 channels of measurement data.
So in the worst case there could be 384 charts visible at the same time.
Usually it’s more likely to be around 24 or 48.
The user will also be switching between different views to monitor the devices he’s working with so UI elements need to be reloaded and repopulated more than once.
I have realized that this might not be possible to do with SciChart as loading 24 charts on their own already takes about a second or two.
I already have placed a call to “SciChart2DInitializer.LoadLibrariesAndLicenseAsync().Wait();” in my startup part of my software.
The chart itself is quiet simple and it is placed within an ItemsControl to be populated as many times as required.:
<ItemsControl Grid.Row="1" ItemsSource="{Binding Path=Data}">

<ItemsControl.ItemTemplate>

<DataTemplate>

<s:SciChartSurface

x:Name="sciChartSurface"

Margin="10"

s:ThemeManager.Theme="BrightSpark"

Background="White"

Style="{x:Null}">

<s:SciChartSurface.RenderSurface>

<s:XamlRenderSurface />

</s:SciChartSurface.RenderSurface>

<s:SciChartSurface.YAxes>

<s:NumericAxis

x:Name="reflectanceAxis"

AxisAlignment="Left"

Id="reflectanceAxis"

IsPrimaryAxis="True" />

</s:SciChartSurface.YAxes>

<s:SciChartSurface.XAxis>

<s:DateTimeAxis x:Name="timeAxis" Id="timeAxis" />

</s:SciChartSurface.XAxis>

<s:SciChartSurface.RenderableSeries>

<s:FastLineRenderableSeries XAxisId="timeAxis" YAxisId="reflectanceAxis" />

</s:SciChartSurface.RenderableSeries>

</s:SciChartSurface>

</DataTemplate>

</ItemsControl.ItemTemplate>

</ItemsControl>
Is there any way that I can improve the loading performance even further?
Attached you can find a stripped down sample project which demonstrates the slow load times I’m experiencing.
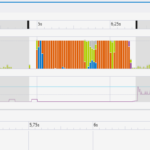
There is also a picture attached where you can see that loading 24 charts blocks the UI thread for about 1.5 seconds.
I am using the latest SciChart version currently available (6.2.1.13304)
- Michael Kollmann asked 4 years ago
 Hi Michael! Team has been made aware of this, apologies for no follow-up so far. I will chase. Best regards, Andrew
- You must login to post comments
Hi Michael,
I’ve looked at your example and I’ve got a few suggestions.
First of all, it’s important to say that SciChartSurface is inherently expensive entity with several child UI elements so creating lots of those is going to be slow. We are aware of the problem and have some long term improvement plans but I don’t think that quickly creating 350 surfaces will be possible even after those are implemented.
So, primary suggestion to fix slow creation would be to avoid creation at all where possible. Basically, you shouldn’t create a surface unless it’s visible to user, and to achieve this you can use techniques such as paging and virtualization which can be further improved by instance pooling. Finally, you may want to consider having multiple series on single surface with some color coding or checkboxes/dropdown to select active device(s) – these usage scenarios are well supported and fast.
As an example I’ve added virtualization to ShellView and it does noticeably improve performance, that improvement will be even larger when increasing number of surfaces.
Finally, XamlRenderSurface is the slowest possible option, in general it’s recommended to use VisualXcceleratorRenderSurface which is hardware accelerated and add some way for user to opt-out of it to HighSpeedRenderSurface in case of GPU-related glitches.
Yours,
Alex
- Alexander Vostres answered 4 years ago
- You must login to post comments
I am considering applying server-side licensing for my javerScript application.
In the document below, there is a phrase “Our server-side licensing component is written in C++.”
(https://support.scichart.com/index.php?/Knowledgebase/Article/View/17256/42/)
However, there is only asp.net sample code on the provided github.
(https://github.com/ABTSoftware/SciChart.JS.Examples/tree/master/Sandbox/demo-dotnet-server-licensing)
I wonder if there is a sample code implemented in C++ for server-side licensing.
Can you provide c++ sample code?
Also, are there any examples to run on Ubuntu?
- Michael Kollmann answered 4 years ago
- You must login to post comments
Please login first to submit.

