Hello
In Tutorial 06b – Realtime Updates, I want change the <s:SciChartSurface.XAxis> from <s:NumericAxis/> to <s:DateTimeAxis/> . I have tried a lot, but it still doesn’t work.
Could you please help me to do this work.
Thank you very much.
- Zhi Zhang asked 8 months ago
- last edited 8 months ago
- You must login to post comments
Hi Zhi Zhang
Starting from our tutorial 06 – Realtime Updates , this declares a NumericAxis for X,Y Axis in XAML like this:
    <s:SciChartSurface Grid.Row="1"
                       RenderableSeries="{s:SeriesBinding RenderableSeries}"
                       ChartTitle="{Binding ChartTitle}">

        <s:SciChartSurface.XAxis>
            <s:NumericAxis AxisTitle="{Binding XAxisTitle}"/>
        </s:SciChartSurface.XAxis>
        <s:SciChartSurface.YAxis>
            <s:NumericAxis AxisTitle="{Binding YAxisTitle}"/>
        </s:SciChartSurface.YAxis>
    </s:SciChartSurface>
If you change the XAxis to DateTimeAxis like this:
        <s:SciChartSurface.XAxis>
            <s:DateTimeAxis AxisTitle="{Binding XAxisTitle}"/>
        </s:SciChartSurface.XAxis>
You will also need to change the type of the data in the viewmodel.
We declare data in MainViewModel in the tutorial our data like this:
public MainViewModel() {
    var dummyDataProvider = new DummyDataProvider();
    var lineData = new XyDataSeries<double, double>() { SeriesName = "TestingSeries" };
    _renderableSeries = new ObservableCollection<IRenderableSeriesViewModel>();
    RenderableSeries.Add(new LineRenderableSeriesViewModel()
    {
        StrokeThickness = 2,
        Stroke = Colors.SteelBlue,
        DataSeries = lineData,
        StyleKey = "LineSeriesStyle"
    });
    // Append the initial values to the chart
    var initialDataValues = dummyDataProvider.GetHistoricalData();
    lineData.Append(initialDataValues.XValues, initialDataValues.YValues);
    // Subscribe to future updates
    dummyDataProvider.SubscribeUpdates((newValues) =>
    {
        // Append when new values arrive
        lineData.Append(newValues.XValues, newValues.YValues);
        // Zoom the chart to fit
        lineData.InvalidateParentSurface(RangeMode.ZoomToFit);
    }); }
Notice the part
var lineData = new XyDataSeries<double, double>() { SeriesName = "TestingSeries" };
For XAxis=DateTimeAxis then the X-Type must be DateTime, e.g.
var lineData = new XyDataSeries<DateTime, double>() { SeriesName = "TestingSeries" };
Now, when appending data, you must append dates:
DateTime[] xValues = ...
double[] yValues = ...
lineData.Append(xValues, yValues);
Now the chart should display correctly.
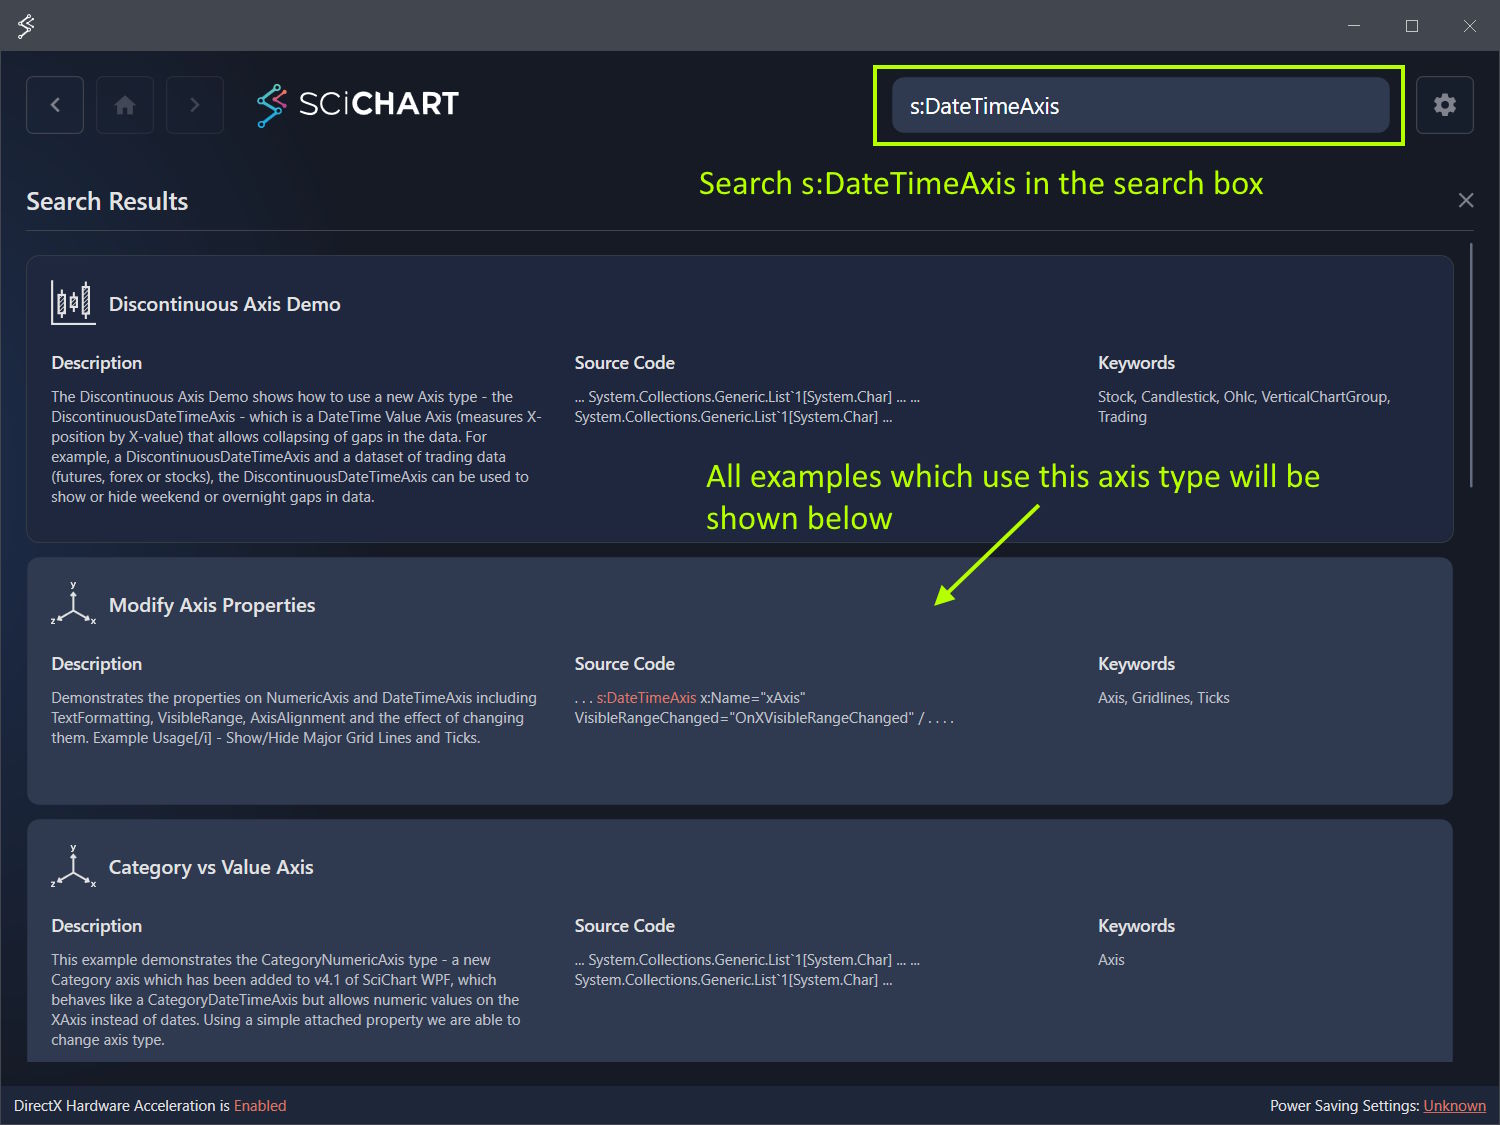
You can find some concrete examples for DateTimeAxis in the WPF Chart Examples suite / demo application. Just search for DateTimeAxis to find examples that use this axis type.
Let me know if this helps,
Best regards
Andrew
- Andrew Burnett-Thompson answered 8 months ago
- You must login to post comments
Please login first to submit.
