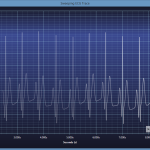
I am attempting to replace an existing chart (Infragistics) as we have now moved this application to a tablet with less processing power and the current solution is using 40 – 50% cpu on said tablet. I am hoping to create a replacement that is much more efficient.
The current chart has 4 wave forms, each displays 8 seconds (which is 4000 points) of data and wraps around on itself with a moving gap just like an ECG machine in a hospital room. The way I get this behavior currently is to create an ObservableCollection with 4000 elements all with NaN values and then update the collection by index resetting the index to 0 when the far right is hit. This is updated from a buffer of incoming datapoints that I create to ensure all points are equidistant by adding points if there are time gaps or dropping points if time overlapped. From what I have read in the forums and samples on how SciChart ECG charts are created that is not the method used. Can anyone suggest the absolute most efficient way to create such a chart using SciChart?
- mdutra asked 10 years ago
- You must login to post comments
Thanks for asking this question! This gets asked a lot so we took the time to create a short video and example for the benefit of our user-base.
Please take a look at the KB Article here on How to Create a Sweeping ECG Chart.
Best regards,
Andrew
- Andrew Burnett-Thompson answered 10 years ago
- You must login to post comments
Please login first to submit.

