Have a good day!
I’m working with render context in modifiers. I have this code snippet:
public override void OnParentSurfaceRendered(SciChartRenderedMessage e)
        {
            if (Mouse.LeftButton == MouseButtonState.Pressed&&IsEnabled)
            {
                if (ParentSurface == null) return;
                var yCalc = ParentSurface.YAxes.GetAxisById(TextOfYAxis);
                var startTVD = yCalc.GetDataValue(StartPoint.Y);
                var finalTVD = yCalc.GetDataValue(CurrentPoint.Y);
                var deltaTVD = Math.Round((double) finalTVD - (double) startTVD);
                var pen = e.RenderContext.CreatePen(Colors.Red,true,1);
                var brush = e.RenderContext.CreateBrush(Colors.Red);
                e.RenderContext.DrawLine(pen, StartPoint, new Point(StartPoint.X, CurrentPoint.Y));
                e.RenderContext.DrawEllipse(pen, brush, StartPoint, 4, 4);
                e.RenderContext.DrawEllipse(pen,brush,new Point(StartPoint.X,CurrentPoint.Y),2,2);
                e.RenderContext.DrawText(
                    new Rect(new Point(CurrentPoint.X - 20, CurrentPoint.Y - 20), new Size(100, 30)), Colors.Red, 10,
                    "Delta TVD:" + Math.Round(Geomodel.DeltaTVD + deltaTVD, 2));
                pen.Dispose();
            }
        }
My aim is to place rectangle below line series.
Is there any way to work with z-index of such method of drawing?
- Vyacheslav Seredkin asked 9 years ago
- last edited 9 years ago
- You must login to post comments
Hi Vyacheslav,
Actually, it is possible, but we haven’t published this part of the API as its only used internally. There is the concept of Layers in the render context.
Take a look at this code
renderContext.Layers[RenderLayer.AxisMajorGridlines].Enqueue(() =>
{
    // any drawing operations here will be performed after the AxisMajorGridlines and before the RenderableSeries
    renderContext.DrawLine( ... )
});
Where RenderLayer is defined as an enum:
/// <summary>
/// Enumeration Constants to define the layers in <see cref="RenderOperationLayers"/>
/// </summary>
public enum RenderLayer
{
    /// <summary>
    /// The Axis Bands render layer, Z-order = 0
    /// </summary>
    AxisBands,

    /// <summary>
    /// The Axis Minor Gridlines render layer, Z-order = 1
    /// </summary>
    AxisMinorGridlines,

    /// <summary>
    /// The Axis Major Gridlines render layer, Z-order = 2
    /// </summary>
    AxisMajorGridlines,

    /// <summary>
    /// The RenderableSeries render layer, Z-order = 3
    /// </summary>
    RenderableSeries
}
Let me know if this helps!
Best regards,
Andrew
- Andrew Burnett-Thompson answered 9 years ago
- You must login to post comments
Hello, Andrew!
Thank you for your advice. I’ve applied this method, and have changed this part of code:
e.RenderContext.DrawLine(pen, StartPoint, new Point(StartPoint.X, CurrentPoint.Y));
                e.RenderContext.DrawEllipse(pen, brush, StartPoint, 4, 4);
                e.RenderContext.DrawEllipse(pen,brush,new Point(StartPoint.X,CurrentPoint.Y),2,2);
                e.RenderContext.DrawText(
                    new Rect(new Point(CurrentPoint.X - 20, CurrentPoint.Y - 20), new Size(100, 30)), Colors.Red, 10,
                    "Delta TVD:" + Math.Round(Geomodel.DeltaTVD + deltaTVD, 2));
To this:
e.RenderContext.Layers[RenderLayer.AxisMajorGridlines].Enqueue(() => e.RenderContext.DrawLine(pen, StartPoint, new Point(StartPoint.X, CurrentPoint.Y)));
                e.RenderContext.Layers[RenderLayer.AxisMajorGridlines].Enqueue(() => e.RenderContext.DrawEllipse(pen, brush, StartPoint, 4, 4));
                e.RenderContext.Layers[RenderLayer.AxisMajorGridlines].Enqueue(() => e.RenderContext.DrawEllipse(pen, brush, new Point(StartPoint.X, CurrentPoint.Y), 2, 2));
                e.RenderContext.Layers[RenderLayer.AxisMajorGridlines].Enqueue(() => e.RenderContext.DrawText(
                    new Rect(new Point(CurrentPoint.X - 20, CurrentPoint.Y - 20), new Size(100, 30)), Colors.Red, 10,
                    "Delta TVD:" + Math.Round(Geomodel.DeltaTVD + deltaTVD, 2)));
                e.RenderContext.Layers.Flush();
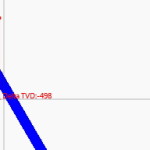
The image that is drawn with render context is situated under annotaions now, but above renderable series (blue line on attached img 1). I need to put this image (thin red line) under renderable series too.
P.S. I have tried all RenderLayers in RenderContext.Layers[].
- Vyacheslav Seredkin answered 9 years ago
 Ahh shoot. I have reviewed the code and the render layers are flushed before the RenderableSeries are drawn. Which means ... the approach I suggested will not work. At the moment the only way to place some UI below the RenderableSeries is to use the Annotations API and set AnnotationBase.AnnotationCanvas = BelowChart. Sorry, we cannot help at the moment without a big code change in SciChart
- You must login to post comments
Please login first to submit.

